Digital Math for 3.MD.3 - Picture and Bar Graphs (Slides + Self-Grading Quiz)


- Grades
- Grade 3, Elementary
- File type
- Multiple File Types


- Subject
- Math, Graphing
- Topic
- interactive learning, graphing
- Resource types
- Quizzes, Quizzes and Tests, Teacher Tools
About this resource
What's inside this resource
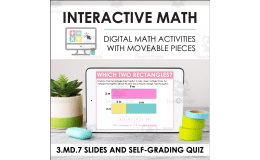
This is a digitally enhanced teaching resource designed to support the development of third-grade students' understanding of picture and bar graphs.
A Unique Learning Tool
The standout feature of this resource is its unique merge of visual mathematics with interactive digital content, enabling students to grasp graphing concepts in a hands-on way.
Wide Device Compatibility
This teaching tool comes in both PowerPoint and Google Slides formats, ensuring easy adaptation across various digital platforms.
Bonus Features:
- Instruction aids for easy assignment distribution.
- Integration capability with Google Classroom.
- Supports small group instruction within both traditional class settings and distance learning situations.
Real-time Student Performance Data
The package includes a self-grading Google Forms quiz that provides teachers instantaneous data on student performances—essential feedback that can inform future instruction while saving crucial grading time.
In summary, Digital Math for 3.MD.3 - Picture and Bar Graphs (Slides + Self-Grading Quiz) serves as an extremely versatile tool that meets educators where they're at—whether it's a public school teacher looking to modernize their math classroom or homeschoolers seeking more interactivity.Related resources
More resources teachers may find useful
24 related resources were found using this product's title, contributor, categories and tags.
In the classroom
Teaching tips & learning objectives

Learning objectives
- Draw scaled picture and bar graphs from tally data
- Solve two-step problems using information in a graph
- Explain the mistake in an incorrect answer about a graph

Teaching tips
- The Google Slides and Forms versions need a Google account; the PowerPoint file can be used offline.

Skills covered
- Graph construction — dragging rectangles or picture icons onto a scaled graph
- Data interpretation — comparing values shown in graphs

No reviews yet
Downloaded this resource? Tell other teachers how it went.
Resource details
Concepts & topics
Core concepts
 Core concepts
- Bar graph
- Picture graph
- Scale
- Tally chart
 Topics
Explore more
Categories this resource belongs to
Explore related searches
More to explore
You may also like