Summertime Graphing Worksheets


About This Product
Summertime Graphing Worksheets
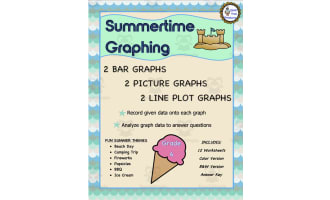
Engage your fourth-grade learners with these vibrant, summer-themed Summertime Graphing Worksheets. These tools offer a fantastic means of sharpening students' graphing skills during the summer or as exciting supplementary material throughout the school year.
What's Contained
- A total of twelve unique worksheets that enhance understanding and consolidate math standards on three graph types: bar graphs, picture graphs, and line plot graphs.
- The exciting themes include adventures at the beach, camping, fireworks shows, popsicle parties, BBQs,, and delightful ice cream events.
- A two-step approach is followed in each sheet requiring graph completion before transitioning to data interpretation on a separate page.
Note:This dual-stage format promotes mastery of data analysis concepts innovatively.
Versatility in Design
The worksheets come in both colourful versions perfect for capturing learners' attention as well as black-and-white options to accommodate different learning environments. An included answer key facilitates quick reviews or independent learner self-checks.
Efficacy & Application
Perfectly aligned with grade 4 math curricula objectives worldwide focusing on data handling skills these resources foster active participation within classrooms and more personalized homeschool settings. Homework assignments can also utilize this bundle encouraging student exploration beyond class hours.
About Availability<\br>The Summertime Graphing Worksheets are distributed appropriately among all educational contexts owing to their easy-to-use format available in PDF form!
This material isn't just another teaching toolset but a praised pedagogical ally seen through its widespread integration into diverse educational settings.
What's Included
12 pages (color and b/w)
Answer Key
PLEASE NOTE: Color and B&W versions are IDENTICAL
Resource Tags
0 Reviews
Check out these other great products