Bar Graphs Worksheets Data and Graphing Column Graphs Tally Marks


About This Product
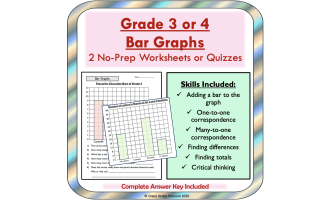
Looking for a data and graphing activity that gets your students moving and learning at the same time? These Bar Graphs Worksheets are the perfect mix of hands-on fun and curriculum-aligned skills practice! With a hands-on, real-world approach, your students will head outside to collect data using tally marks—yes, real data from your staff car park!
From Observation to Representation
Your students will observe car colors and record their findings using tally marks. Then, they’ll transfer that data into a clear and colorful column (bar) graph. It’s a simple yet powerful way to connect real-life observation with structured math skills.
Deepen Thinking with Data Interpretation
Once the graphs are complete, students answer a series of questions to analyze and interpret the data. This step encourages them to think critically, make comparisons, and draw conclusions based on evidence—hello, higher-order thinking!
What’s Included
✔️ Tally mark data collection sheet
✔️ Column/Bar graph template
✔️ Comprehension questions for data interpretation
✔️ US and British English versions for flexible classroom use
Perfect For:
Math centers or rotations
Early finishers
Outdoor learning experiences
Grades 2–4 (or adaptable for other levels)
Real-life, cross-curricular connections
Why Teachers Love It
This resource is more than just a worksheet—it's an experience. Students are actively engaged, moving, thinking, and connecting math to the world around them.
Real data. Real math. Real fun.
Bring graphing to life and turn your next math lesson into a mini adventure!
Resource Tags
0 Reviews
Check out these other great products