Conditional Probability – Venn + Tree Diagrams Review

- Grades
- Grades 9–11
- File type
- Microsoft Word


- Subject
- Geometry, Math
- Topic
- Probability, Review
- Resource types
- Diagrams
From the author
About this resource
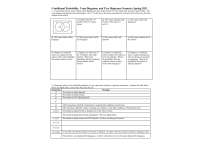
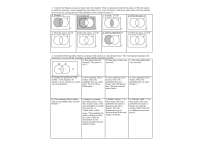
This review guide comes with 4 pages of questions for your students and an answer key.
Related resources
More resources teachers may find useful
More resources on the same subject and topic.

In the classroom
Teaching tips & learning objectives

Learning objectives
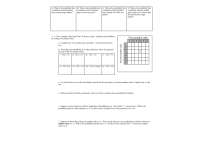
Students will use a two-circle Venn diagram to find subset counts, such as how many students study only one of two languages.
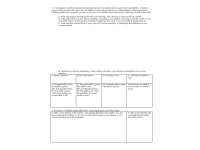
Students will draw and label a tree diagram for a without-replacement probability scenario, multiplying branch probabilities to find outcome probabilities.
Students will calculate a conditional probability, such as P(sum = 7 | at least one die shows 3), from a two-dice sum chart.

Teaching tips
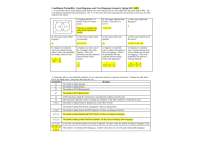
Review union, intersection, and complement set notation before assigning the shaded-region problems, since students fill in or describe regions using this vocabulary.
Work through the marble tree-diagram example as a class first, since correctly adjusting the second draw's probability after removing a marble is the step students most often miss.
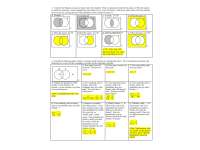
Use the answer key to spot-check the algebra-heavy Venn diagram problem (31 students split across two activities), since an early miscount there affects every sub-question that follows.

Skills covered
Set notation — describing or filling Venn diagram regions using union, intersection, and complement.
Venn diagram interpretation — reading subset counts and regions from a two-circle diagram of overlapping categories.
Conditional probability calculation — finding P(A | B) from a two-dice sum chart and from survey-style word problems.

No reviews yet
Downloaded this resource? Tell other teachers how it went.
Resource details
Concepts & topics
Core concepts
 Core concepts
Conditional probability
Venn diagrams
Tree diagrams
Topics
 Topics
Explore more
Categories this resource belongs to
Explore related searches



More to explore