Linear Functions – Multiple Representations Worksheet



- Grades
- Grades 8–9
- File type
- Preparation
- Print ready


- Subject
- Algebra, Math
- Topic
- Algebra, Linear Functions
- Resource types
- Worksheets
- Preparation
- Print ready
From the author
About this resource
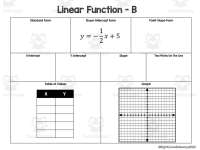
This linear-functions worksheet set connects equations, slope, intercepts, points, tables and graphs. Charts A–H start from given information; chart I asks students to create a function.
The seventeen-page PDF contains nine student charts and eight answer charts. The key identifies cells where valid responses may vary.
Related resources
More resources teachers may find useful
More resources on the same subject and topic.


In the classroom
Teaching tips & learning objectives

Learning objectives
Convert a linear equation between standard form, slope-intercept form, and point-slope form.
Determine the x-intercept, y-intercept, and slope of a line from any one of its given representations.
Generate a table of values and a graph for a line from an equation, and vice versa.
Construct an original linear function and represent it across all of these forms.

Teaching tips
Assign one or two functions per class period rather than all nine at once, since each chart requires working through six to seven interconnected representations for a single line.
Discuss with students why some chart cells are marked "Answers May Vary" (for example, when choosing two points on a line), so they understand multiple correct answers are possible rather than assuming they made an error.
Use Function I, "Create Your Own," as a formative check after the first eight functions, since it requires students to generate and represent a line themselves rather than transform a given one.

Skills covered
Form conversion — students rewrite a linear equation among standard form, slope-intercept form, and point-slope form starting from just one given form.
Slope and intercept identification — students determine a line's x-intercept, y-intercept, and slope from whichever representation is provided.
Graphing and tabulating — students build a table of values and plot a graph consistent with the function's equation.
Function construction — in the "Create Your Own" chart, students invent a linear function and represent it across every format themselves.
Good to know
Questions teachers ask about this resource
Does every chart give the same type of starting information?
No — some functions start from standard form (2x - 4y = 12), others from point-slope form, and others from just a y-intercept and slope, so students practice working forward from different starting representations.

No reviews yet
Downloaded this resource? Tell other teachers how it went.
Resource details
Concepts & topics
Core concepts
 Core concepts
Linear functions
Multiple representations
Slope-intercept form
Point-slope form
 Topics
Explore more
Categories this resource belongs to
Explore related searches




More to explore