Data | Academic Workbook


About This Product
Data Academic Workbook: An Extensive Teaching Tool
The Data Academic Workbook is a comprehensive educational tool offering educators 28 pages of diverse mathematical exercises. The worksheets' content runs a gamut from written activities to multiple choice assessments, accommodating different teaching methods. Schools can leverage this flexible workbook in numerous ways to align with their teaching strategy, such as implementing it during group instruction, facilitating small group discussions, or assigning it as homework.
Key Focus Areas
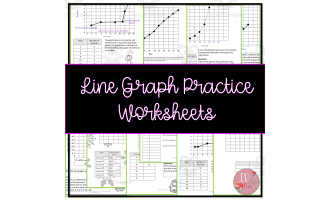
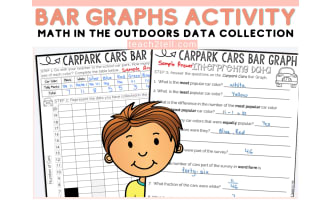
- Data Collection and Display: The workbook covers exhaustive categories like data gathering and data visualization. It incorporates fundamental graph concepts aiding students in constructing, reevaluating and documenting observations from concrete graphs such as pictographs and bar graphs.
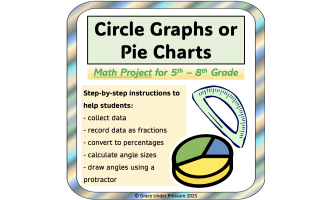
- Introduction to Circle Graphs & Venn Diagrams: In addition to standard graphs, the resource provides an opportunity for educators to expose students to circle graphs and Venn diagrams while also empowering them with the skills necessary for reading and interpreting these visual aids.
- Diving into Probability: Not just stopping at exploring several types of graphing solutions but digging deeper into Probability too! Through this section, teachers can find resources helping them organize experiments by penning down all outcomes along with the respective probabilities attached.
In pursuit of instilling a better understanding of probability amongst grade 5 students; recurrent terms found throughout these worksheets include 'certain', 'very likely', 'likely', 'unlikely', 'very unlikely' ,and Comparative analysis using these terms is spurred through this material.
Digital Convenience at Your Fingertips: Contained within one easily printable pdf file, these valuable teaching resources serve the convenience needs of all educators across public and homeschooling facilitating a stronger foundation in essential math skills for student's future progression, especially in Statistics.What's Included
1 PDF with 28 ready to print pages
Resource Tags
0 Reviews
Check out these other great products