


Data, Tables, Graphs and Charts Math Packet


About This Product
Data, Tables, Graphs and Charts Math Packet
The Data, Tables, Graphs and Charts Math Packet is an essential tool for progressive 5th-grade educators. This printable packet is ten pages long and available as a PDF file. It is designed to integrate data analysis, tables, graphs, and charts within the math curriculum.
Key Learning Concepts
- Gathering data systematically.
- Recording results meticulously.
- Employing diverse types of tables, charts graphs including conversion diagrams for representation.
- Developing predictive abilities from acquired data.
- Engaging in informative discussions about findings.
- Understanding different types of averages: - mean median mode -
This packet provides ample flexibility for students to interact with each page effectively. Learners are encouraged to actively analyze varying forms of data across multiple situations. They are prompted to make observations and formulate answers based on their findings.
Possible Scenarios for Use
- Ideal as homework material after teaching sessions .
- Serves well as review material to reinforce learning concepts .
Duplicates could be kept in an Emergency Substitute Kit.
Iii could be employed as an assessment tool due to detailed coverage; offering thorough evaluation. Li /ol The versatility of this resource ensures deep engagement with complex ideas presented in easily understandable parts complete with answer keys—making it useable even by self-guided learners. A highly recommended addition that synchs well into any dynamic educator’s toolkit focused on cultivating independent critical thinking skills amongst youngsters today.
What's Included
A printable 10-page PDF
Resource Tags
0 Reviews
Explore related searches
you may also like...
Check out these other great products
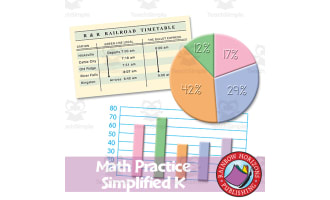
Worksheets & Printables, Word Problems, Worksheets


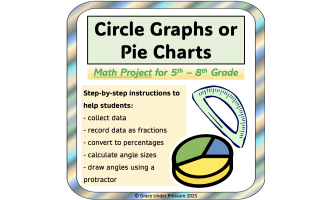
Worksheets & Printables, Worksheets, Lesson Plans, Teacher Tools, Projects, Activities
Activities, Games
Worksheets & Printables, Worksheets
Teacher Tools, Lesson Plans
Worksheets & Printables, Worksheets