Dollar Street Extension Activities-Fully Editable!
- Grades
- Grades 6–8, High School
- Pages
- 2
- File type
- Microsoft Word
- Editable
- Yes


- Subject
- Social Studies, Economics
- Topic
- Dollar Street, Global inequality
- Resource types
- Worksheets
- Editable
- Yes
- Standards
- 6.RP.A.3
Product description
From the author
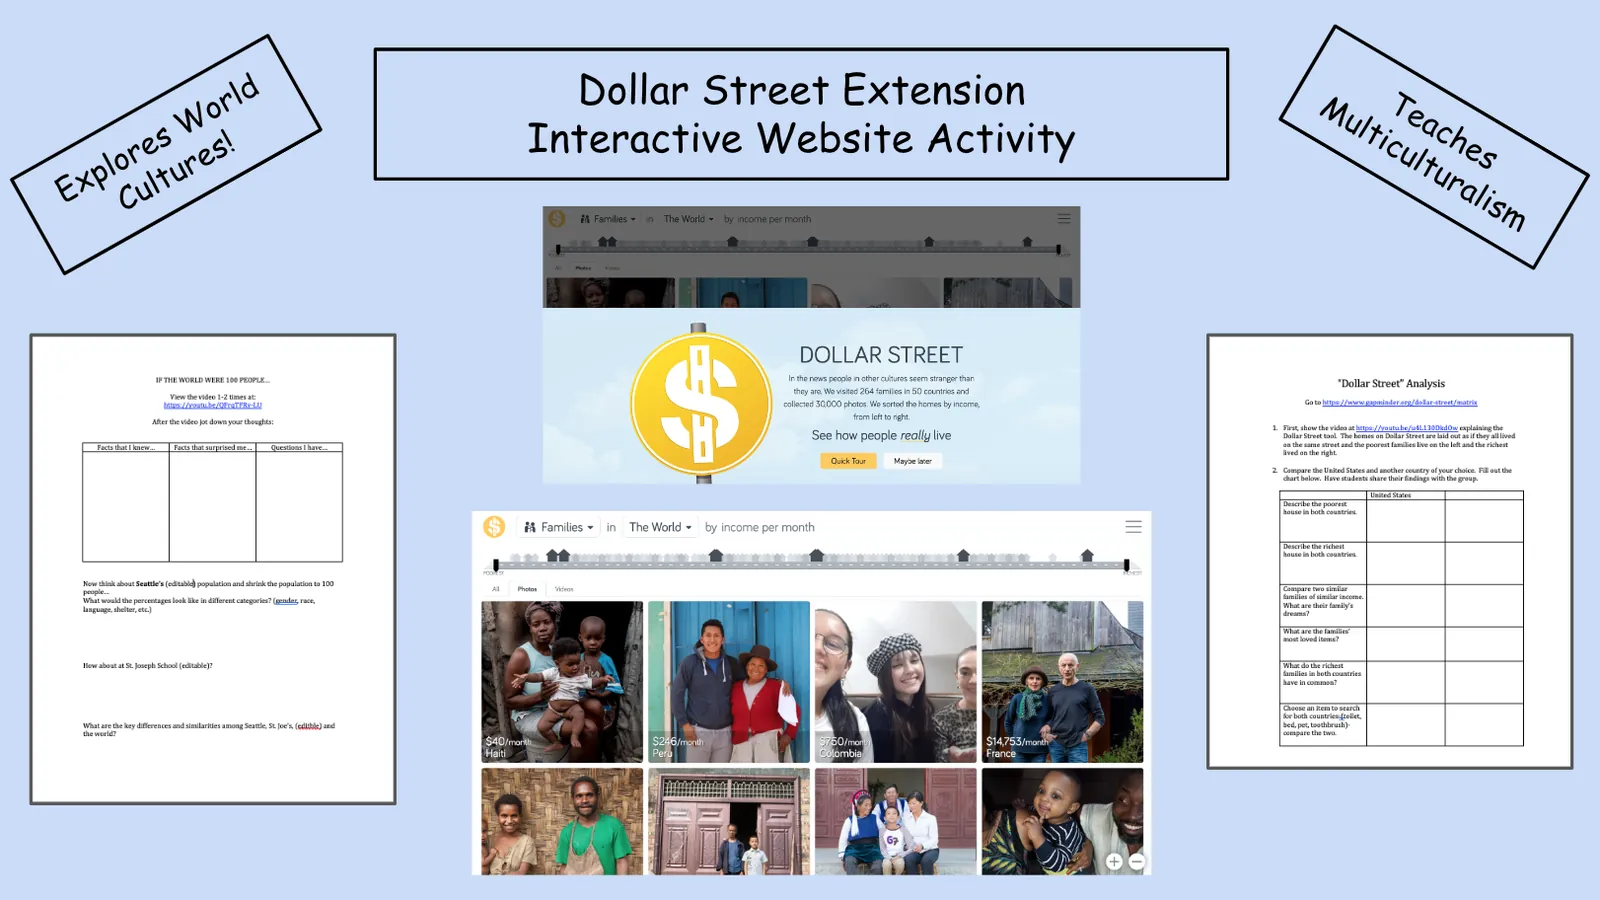
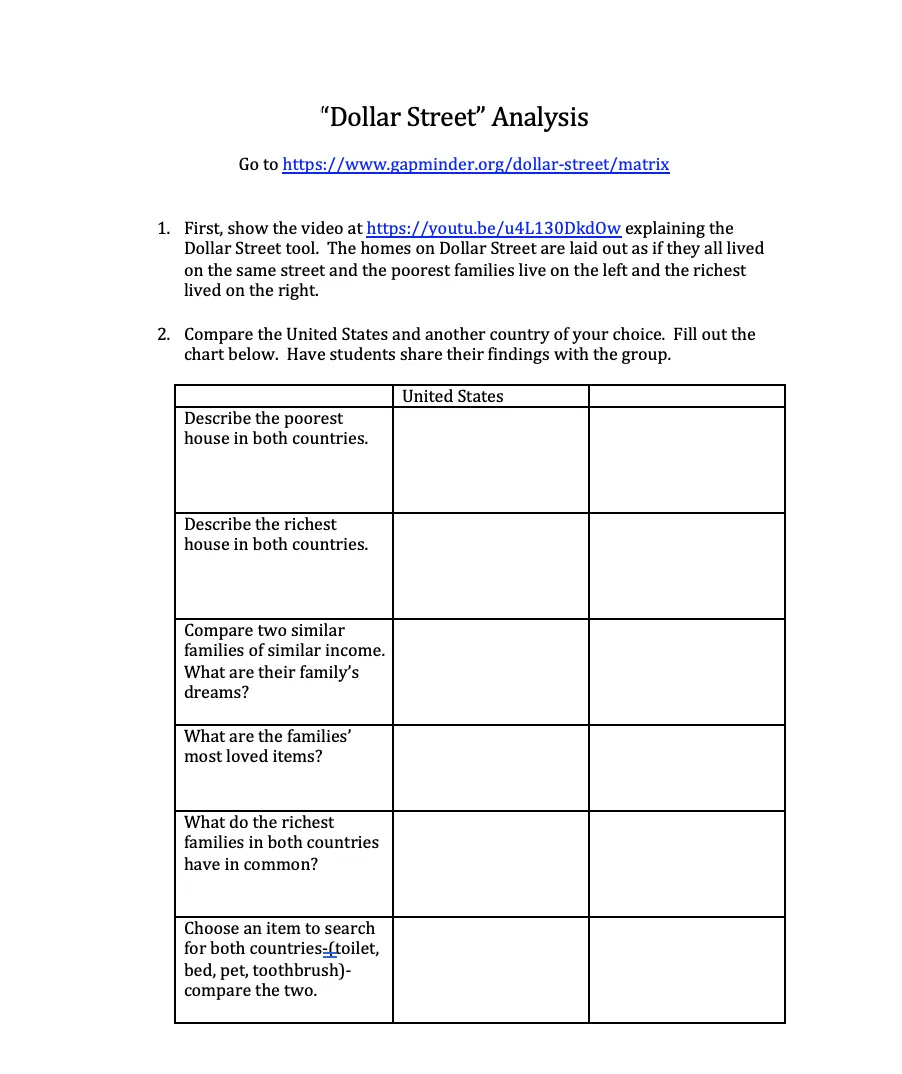
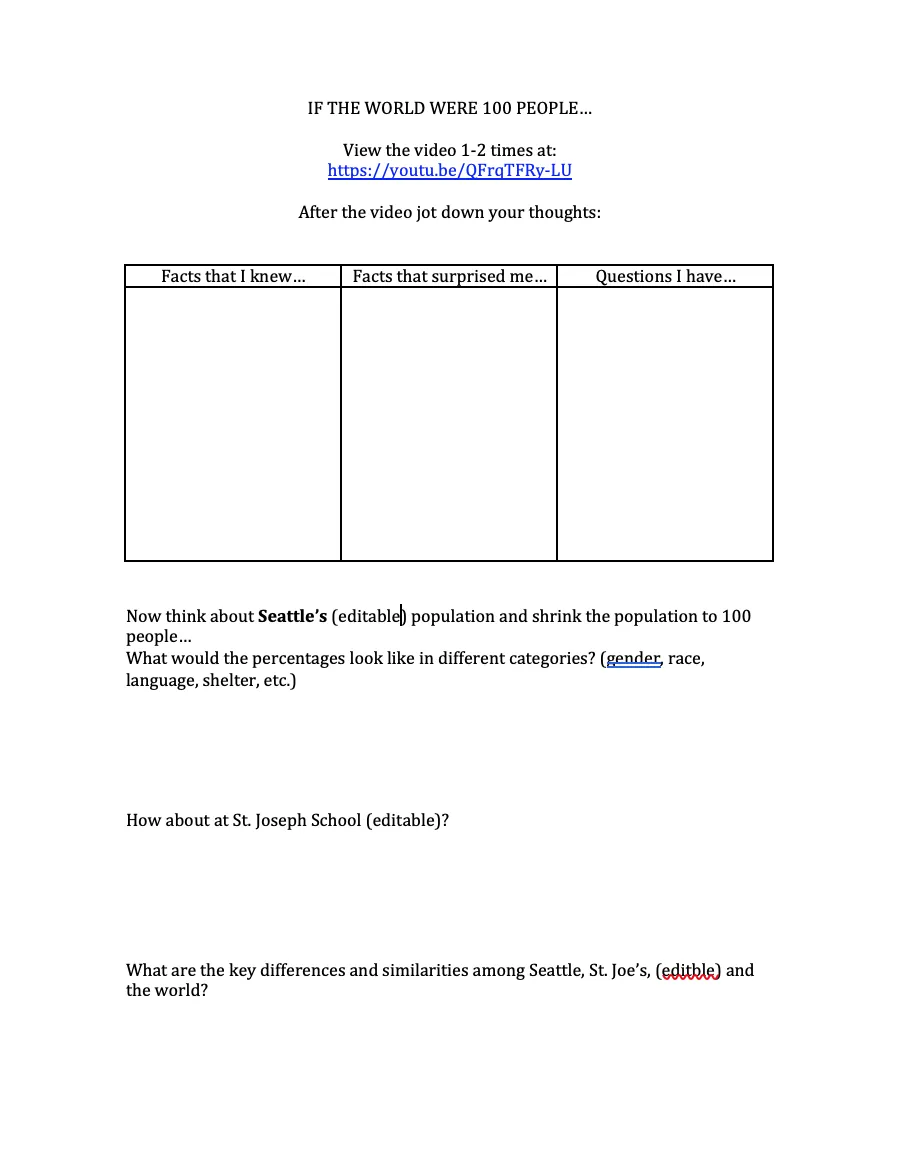
These are two social studies, world cultures, separate advisory or homeroom lessons to help students understand the world better. They could be two separate lessons or one long one. The pictures shown are from the videos. In the "If The World Were 100 People" lesson, the engaging video link describes the world's population filtering for income, technology, language, etc. In the editable handout, teachers can tailor the analysis to their city and school. Students will answer questions about the video as well as analyze their own city and school communities. In the Dollar Street lesson, there is a video link to view the explanation of the Dollar Street tool-which presents selected families from many countries. The tool displays the homes as if they all lived on the same street where the richest live on the right and the poorest live on the left and everyone else in between. It is an amazing tool. For both lessons, teachers need internet access, a way to show the videos, and the ability to print off both handouts. Both handouts are FULLY editable to tailor to your school and city communities.
Related resources
More resources teachers may find useful
24 related resources were found using this product's title, contributor, categories and tags.


In the classroom
Teaching tips & learning objectives

Learning objectives
Students compare lower- and higher-income households shown for two countries using the Dollar Street tool, identifying similarities and differences in family priorities and possessions across income levels.
Students examine a global hundred-person model, then apply that scaling approach to their own school or local community and compare the results.

Teaching tips
Show both videos before students begin their charts, since each activity is built around watching a short video first and then responding to it.
Edit the placeholder community name and school name in the "If the World Were 100 People" document to match your own class before printing, since the file is provided as an editable Word document for this purpose.
Have students share their Dollar Street comparison chart findings with the group afterward, as the activity instructions suggest.

Skills covered
Comparative data analysis — students compare household wealth indicators between two countries using a real interactive data tool.
Proportional reasoning — students apply a hundred-person model to local population statistics and compare it with the global model.
Reflective discussion — students record prior knowledge, new information, and open questions after watching a video, then discuss.
Good to know
Questions teachers ask about this resource
How does this resource help students understand global economic inequality in a concrete way?
Students compare selected households shown by Dollar Street at different income levels, looking at homes, possessions and priorities. These examples support discussion; they are not a complete survey of either country.

No reviews yet
Downloaded this resource? Tell other teachers how it went.
Curriculum
Standards, concepts & topics
Standards
 Standards
- 6.RP.A.3
Core concepts
 Core concepts
Global awareness
Socioeconomic comparison
Data analysis
 Topics
Explore more
Categories this resource belongs to
Explore related searches
More to explore
You may also like