Paper Towel Absorbency Test – Scientific Method Lesson


- Grades
- Grades 4–6
- Pages
- 96
- File type
- Multiple File Types
- Answer key
- Included


- Subject
- Science
- Topic
- Paper towel absorbency, Scientific method
- Resource types
- Worksheets
- Answer key
- Included
- Standards
- 6.SP.B.5
Product description
From the author
Paper Towel Absorbency Test - Scientific Method Lesson Included
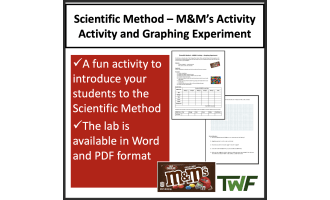
This engaging activity introduces students to the scientific method through an experiment involving a common household material - paper towels.
Students will form a hypothesis about which paper towel will be the most absorbent. They will then collect data by placing different paper towel brands into a liquid to see the effect.
Your students are provided with clear procedures that will guide them to record their results in a well-organized data table and graph. As a class, data can be compiled and averages calculated to identify trends.
Students learn important data analysis skills as they create graphs to visually represent the results. Educators will appreciate the post-experiment reflection questions that reinforce the purpose and process of the scientific method.
This hands-on lab nurtures students' natural curiosity while teaching fundamental experimental design. With its real-world topic and tactile investigation, it motivates learners across various grades and learning styles.
After completing the activity, students will better understand how to use observation, critical thinking, and representation of evidence to answer a testable question.
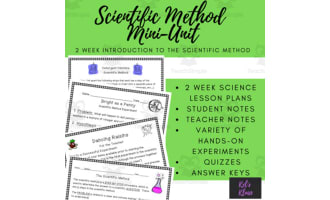
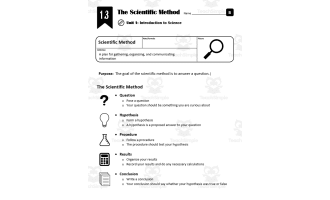
Additionally, this resource includes my lesson on the Scientific Method. The lesson includes a detailed overview of what the scientific method is as well as how to implement it.
Related resources
More resources teachers may find useful
24 related resources were found using this product's title, contributor, categories and tags.

In the classroom
Teaching tips & learning objectives

Learning objectives
Design and carry out a controlled experiment testing paper towel absorbency across three brands
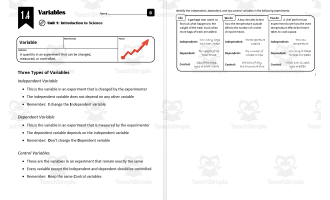
Identify independent, dependent, and controlled variables and a control group within a given experiment scenario
Write a testable if/then hypothesis for a given research question

Teaching tips
Use the Student Lesson Outline and student slide deck to teach scientific-method vocabulary before assigning the paper towel experiment as the applied task
Use the Lab Extension Activity ideas, such as timing absorbency or testing other liquids, for early-finisher groups
Review the embedded 'Burger Power' control-group example together, since it is used as a practice scenario for identifying variables before students design their own experiment

Skills covered
Experimental design — students plan a controlled test comparing three paper towel brands using a graduated cylinder and timer.
Hypothesis writing — students write if/then hypotheses such as predicting which towel brand will absorb the most water.
Data graphing conventions — students apply rules for titling, labeling, and scaling a graph of their absorbency averages.
Good to know
Questions teachers ask about this resource
How do the slide versions differ?
The student slides leave blanks for guided notes. The teacher slides and matching PDF show the completed terms and answers for the same content.

No reviews yet
Downloaded this resource? Tell other teachers how it went.
Curriculum
Standards, concepts & topics
Standards
 Standards
- 6.SP.B.5
Core concepts
 Core concepts
Scientific method
Variables and hypothesis
Data collection and graphing
Controlled experiment
 Topics
Explore related searches
More to explore
You may also like