Scientific Method – M&M’s Activity – Graphing Experiment and Lesson


- Grades
- Grades 6–9
- Pages
- 95
- File type
- Multiple File Types
- Answer key
- Included


- Subject
- Science
- Topic
- Scientific method, Graphing
- Resource types
- Lesson Plans, Experiments, Presentations
- Answer key
- Included
Product description
From the author
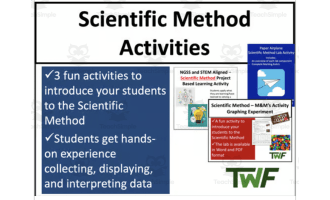
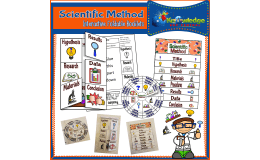
This colorful activity introduces students to both the scientific method and data analysis through hands-on exploration of M&M distributions.
Using a familiar snack, students will form a hypothesis about which candy colors occur most frequently. Clear procedures guide your students to sort, count, and record M&M colors from multiple sample packs. Their results tables lead to graphing skills as data is compiled and percentages calculated.
Students learn by doing as they compare their color predictions with observed counts and analyze the pooled results. Post-lab reflection questions help internalize the purpose and cognitive skills nurtured. The thorough companion lesson defines each component of the method. Examples illustrate how curiosity and evidence-based thinking benefit discovery. This multi-sensory lab motivates learners across disciplines through discovery fueled by their own observations. After participating, students emerge with a strengthened understanding of systematic investigation and interpretation of quantitative results.
Additionally, this resource includes my complete lesson on the scientific method. The lesson will teach your students what the scientific method is as well as how it can be carried out to solve problems and get answers to questions. You, as their teacher, will appreciate how the included lesson reinforces each stage of the scientific process, from questioning to discussing conclusions.
Related resources
More resources teachers may find useful
24 related resources were found using this product's title, contributor, categories and tags.


In the classroom
Teaching tips & learning objectives

Learning objectives
Identify the independent and dependent variable in a described experiment or investigation.
Write a testable if/then hypothesis for a given scientific question.
Evaluate an experiment's results and possible sources of error in post-lab discussion questions.

Teaching tips
Have each group weigh their M&M's without the bag so students can compare their measured mass to the package label in post-lab question 5.
Use the completed teacher slide deck to check student answers on the practice variable and hypothesis exercises before assigning the M&M's activity.
Hand out the Student Lesson Outline for students to fill in during the slide lesson instead of copying notes from the board — it mirrors the slide content in note-taking form.

Skills covered
Experimental design — students identify independent and dependent variables across sample scenarios (an archer's bow, a pendulum, sleep and test scores) before designing their own M&M's investigation.
Graphing conventions — a rules checklist teaches titling, axis labeling, and scaling before students construct their own bar graph of the M&M data.
Scientific error analysis — post-lab questions ask students to evaluate their hypothesis, results, and what they would change if repeating the experiment.
Good to know
Questions teachers ask about this resource
What size M&M sample does the activity call for?
Each lab group works with one full pack of M&M's, and results from five groups are pooled into a single class results table before graphing.

No reviews yet
Downloaded this resource? Tell other teachers how it went.
Resource details
Concepts & topics
Core concepts
 Core concepts
Scientific method
Independent and dependent variables
Hypothesis formation
Data graphing
Percent of a whole
 Topics
Explore more
Categories this resource belongs to
Explore related searches
More to explore
You may also like