Statistics: Calculating Results

- Grades
- Grades 8–11, High School, Middle School
- File type
- Multiple File Types


- Subject
- Math, Statistics
- Topic
- statistics, data analysis
- Resource types
- Activities, Projects
About this resource
What's inside this resource
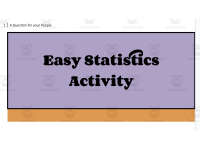
A unique teaching resource designed to aid middle and high school educators in teaching the value of thorough research and understanding statistical accuracy. This tool is most appropriate for grades 8 through 11, focusing on Math - specifically Statistics.
Statistics: Calculating Results integrates real-life investigations with mathematical truths, aiming to help students discern true from false information they encounter online.
A Hands-On Approach Activity
The resource provides a hands-on approach that actively encourages student participation in data collection. Such fieldwork helps foster engagement and practical application of learning outside the classroom's environment, giving math principles real-world context.
Upon completion of this exercise, students can compile their collected data together with those gathered by classmates. This collective task enables them to establish a definitive declaration about their findings concerning the conducted experiment.
This educational activity prioritizes fostering an analytical mindset as much as it does solving equations.
About The Repository Contents
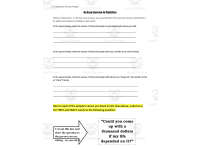
The repository consists of four pages including one page where students note down collected data from respondents;
The remaining two pages offer comprehensive explanations supported by examples which assist teachers instructing these studies more effectively.
Flexibility And Convenience:
This activity can be implemented during classroom instruction for group work or independently assigned for homework – offering flexibility in pedagogical approaches.
This tool comes in Word document file format allowing teachers to modify or adjust it according to each class's needs while retaining its core educational value.
Related resources
More resources teachers may find useful
24 related resources were found using this product's title, contributor, categories and tags.
In the classroom
Teaching tips & learning objectives

Learning objectives
- Calculate percentages for each category of class survey data
- Interpret what pooled survey results show
- Identify limitations and sources of bias in a self-collected study

Teaching tips
- Students need to reach nine people outside class, in person, by phone, text or email, so the survey must be assigned ahead of the class tally.

Skills covered
- Data collection — recording exact answers from nine interviewees
- Tallying — combining the class's yes and no responses by category on the board

No reviews yet
Downloaded this resource? Tell other teachers how it went.
Resource details
Concepts & topics
Core concepts
 Core concepts
- Data collection
- Frequency tally
- Percentages
- Sampling bias
 Topics
Explore more
Categories this resource belongs to
Explore related searches
More to explore
You may also like