Graphing Practice Worksheets

- Year groups
- Years 7–9 (Key Stage 3)
- File type
- Preparation
- Print ready


- Subject
- Graphing, Maths
- Topic
- Line Graphs, Graphing Practice
- Resource types
- Worksheets
- Preparation
- Print ready
From the author
About this resource
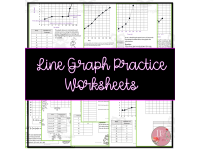
This resource is a set of Graphing Practice Worksheets.
You can teach, practice, and review line graphs with these fun activities.
Use them in small groups, as a bell ringer or exit ticket, or as homework.
Related resources
More resources teachers may find useful
More resources on the same subject and topic.


In the classroom
Teaching tips & learning objectives

Learning objectives
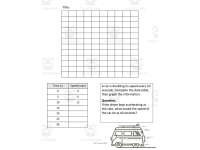
Students construct a line graph from a data table, correctly labelling the title, both axes, units, and a consistent scale.
Students distinguish independent variables (x-axis) from dependent variables (y-axis) in a given data set.
Students read an existing line graph to reconstruct its underlying data table and describe the trend it shows.
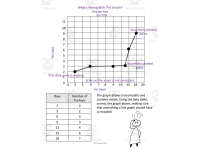
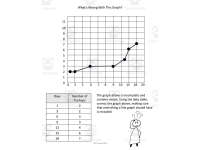
Students identify specific errors in a flawed line graph (missing title, missing label, inconsistent scale, misplotted points) and correct them.

Teaching tips
Introduce the info sheet's four graph requirements (title, labelled axes, units, consistent scale) before assigning any worksheet, since every task is marked against that checklist.
Use the 'What's Wrong With This Graph?' worksheet as a review or assessment task after the other three, since it requires applying all four requirements at once to find each error.
Use the included blank graph and data table template for a student-generated data set as an extension activity.
Have students verify the car-speed doubling pattern by calculating the next two data points themselves before checking the answer key.

Skills covered
Line graph construction — students plot data with a title, labelled and scaled axes, and units, using scenarios like weather temperature and car speed.
Independent vs. dependent variable identification — students identify which quantity belongs on the x-axis versus the y-axis in each scenario.
Graph-to-table translation — students read a completed plant-growth line graph to reconstruct its missing data table.
Graph error analysis — students diagnose a flawed graph missing a title, axis label, consistent scale, and a plotted point, then produce a corrected version.

No reviews yet
Downloaded this resource? Tell other teachers how it went.
Resource details
Concepts & topics
Core concepts
 Core concepts
Line graph
Independent variable
Dependent variable
Data table
Scale
 Topics
Explore more
Categories this resource belongs to
Explore related searches



More to explore