6th Grade Math Worksheets for Statistics and Probability


About This Product
Do you need some new ideas for your 6th grade math unit to meet the Common Core State Standards for Statistics and Probability? Here is a ready-to-go bundle with four fun real-life activities to incorporate into your unit plan.
1) Statistical Questions: Students are taught what a statistical question is: a question that has numerical answers that vary.. 8 questions are included. Students need to identify if they are statistical questions or not. If they are, students think of how the data might be collected. If they are not, students explain what aspects of a statistical question are missing. Finally, students write 4 questions of their own (one should not be a statistical question) and they trade with a friend to see if they can identify the odd one out.
2) Dot Plots and Histograms: Students will collect numerical data through a survey and create their own dot plots and histograms to display their findings! This gives them a sense of ownership over their learning, and it is a great way to assess their skills! Discussion questions and self-assessment are included.
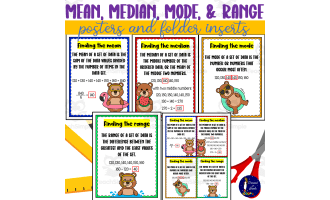
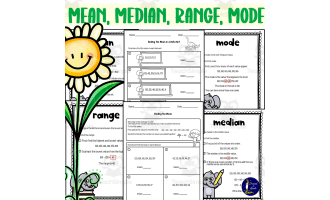
3) Math Stations: Statistics and Probability: Station 3 in particular has students create a dot plot and calculate the mean, median and mode of provided data. They can also do the probability stations if you want to address those skills.
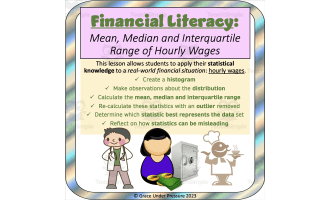
4) Mean, Median and Interquartile Range of Hourly Wages: From a cashier to a taxi driver to an account to a CEO, students are given 10 realistic hourly wages.
First, they create a histogram to display the data. Next, they write the wages in order from smallest to largest. They use this information to calculate the mean, the median, and the interquartile range. After that, they eliminate the outlier (the CEO wage) and recalculate the same statistics. Discussion questions are included.
Grades to Use With:
This bundle is designed for students in Grade 6, but can be used for Grade 5 enrichment, Grade 7 or 8 review, or high school special education classes.
What's Included:
20 Page PDF with 4 Activities
Resource Tags
0 Reviews
Check out these other great products