Range, Mode, Median, and Mean Worksheet Set
- Grades
- Grades 4–6, Elementary, Middle School
- File type
- Preparation
- Print ready


- Subject
- Math, Statistics
- Topic
- Math Worksheet, Math Homework
- Resource types
- Worksheets & Printables, Worksheets
- Preparation
- Print ready
About this resource
What's inside this resource
If you want to give students extra practice with data analysis, I have just the resource for you.
What You Get:
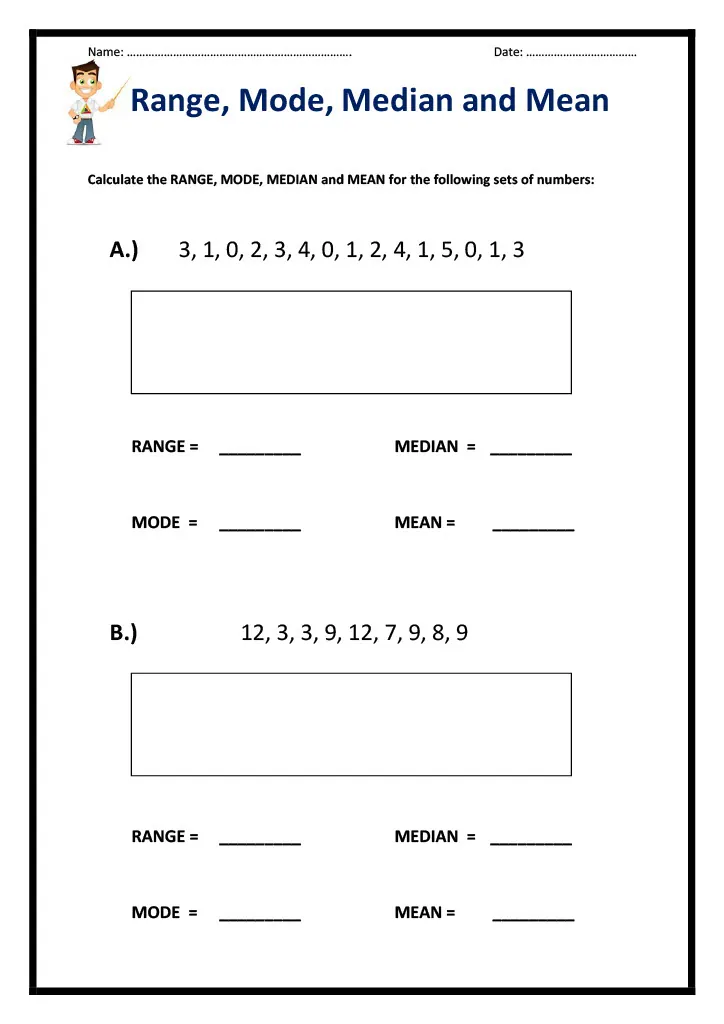
This is a Range, Mode, Median, and Mean Worksheet Set that was designed for elementary students who are working on or have mastered this skill. It also works well as a review for students. There are 2 separate PDFs included:
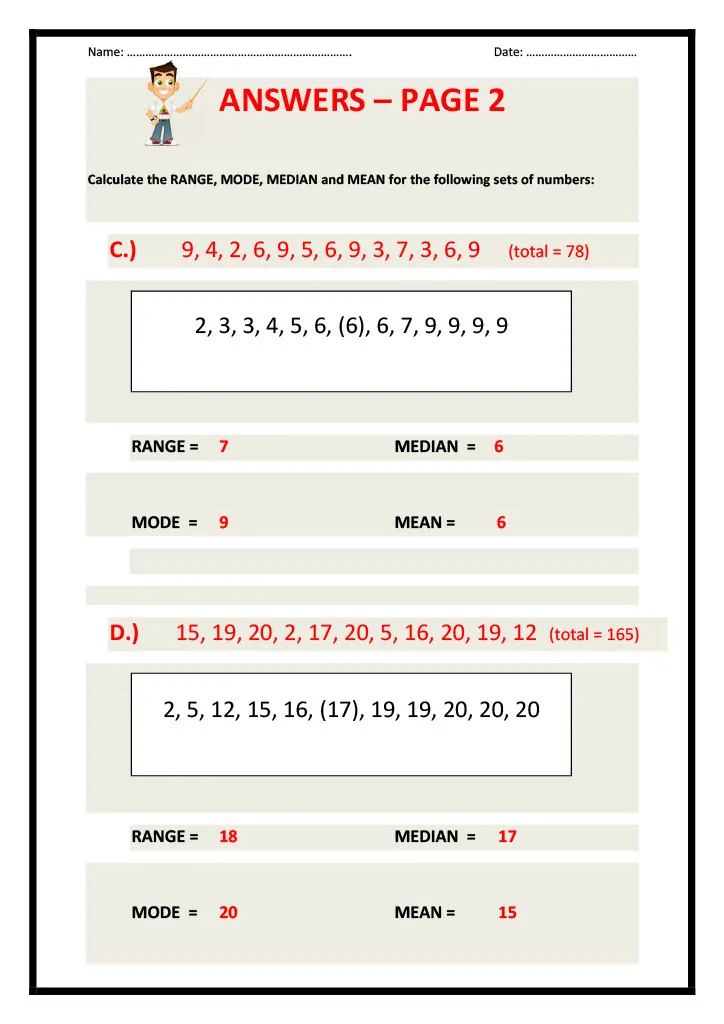
- Worksheet with 6 problems and an answer key
- Teaching notes
How To Implement This Resource:
You can print off enough copies of the worksheet for each student to have. You may also choose to print only a few copies and laminate those. If you choose to laminate them, students can use dry erase markers to solve the problems. This is a great activity to place into a math center or small group activity.
The graphic organizer for the teaching notes is a great resource to implement before, during, and after instruction. This chart is a useful reference that will provide definitions and examples. The Range, Mode, Median, and Mean Worksheet consists of 6 problems across 3 pages. For each problem, there is a set of numbers. Students will find all 4 measures for each set. An answer key is included. This worksheet can be completed independently, as a homework assignment, or even small groups.
I hope you enjoy!
Here are more of my resources for you to enjoy:
Make Your Own Parachute Activity
Materials and Properties of Materials Sorting Game
You can find more resources at my storefront here: Elementary Resources 4 U
Related resources
More resources teachers may find useful
24 related resources were found using this product's title, contributor, categories and tags.


In the classroom
Teaching tips & learning objectives

Learning objectives
Calculate the range, mode, median, and mean for data sets of varying size (6 to 15 numbers).
Round a non-terminating mean to two decimal places when the total does not divide evenly.
Identify a data set with more than one mode.

Teaching tips
Have students show their sorted list (as in the answer key) before finding the median, especially for the two even-numbered sets where the median is the average of the two middle values.
Preview the Teaching Notes sheet as direct instruction before assigning sets A-F, since its example data sets differ from the worksheet's own and are meant as a general model rather than a worked answer to a specific problem.
Flag the two sets requiring decimal rounding (4.57 and 4.17) in advance, since the other four sets resolve to whole-number means.

Skills covered
Range calculation — students subtract the lowest from the highest value in each data set.
Mode identification — students find the most frequent value, including a data set with two modes.
Median calculation — students order data and find the middle value, averaging two middle values for even-sized sets.
Good to know
Questions teachers ask about this resource
Do the Teaching Notes' example data sets walk through the same numbers as worksheet sets A-F, so I can use them as a model for a specific problem?
No — the Teaching Notes use their own two example sets (2,2,3,5,5,7,8 and 2,3,3,4,6,7), separate from the worksheet's A-F sets, so they function as a general explanation of the four measures rather than a worked solution to any specific worksheet problem.
Set E's answer key lists two values as the mode (2 and 5) — is that a mistake, or can a data set have more than one mode?
It's correct as shown: a data set can have more than one mode when two or more values tie for the highest frequency, as happens with 2 and 5 in Set E.

No reviews yet
Downloaded this resource? Tell other teachers how it went.
Curriculum
Standards, concepts & topics
Standards
 Standards
- 6.SP.B.5 — Summarize numerical data sets in relation to their context, such as by: a. Reporting the number of observations. b. Describing the nature of the attribute under investigation, including how it was measured and its units of measurement. c. Giving quantitative measures of center (median and/or mean) and variability (interquartile range and/or mean absolute deviation), as well as describing any overall pattern and any striking deviations from the overall pattern with reference to the context in which the data were gathered. d. Relating the choice of measures of center and variability to the shape of the data distribution and the context in which the data were gathered.
- 6.SP.A.3 — Recognize that a measure of center for a numerical data set summarizes all of its values with a single number, while a measure of variation describes how its values vary with a single number.
- 5.NBT.B.7 — Add, subtract, multiply, and divide decimals to hundredths, using concrete models or drawings and strategies based on place value, properties of operations, and/or the relationship between addition and subtraction; relate the strategy to a written method and explain the reasoning used.
Core concepts
 Core concepts
range
mode
median
mean
measures of central tendency
 Topics
More to explore
You may also like