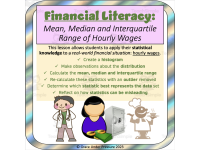
Financial Literacy: Mean, Median & Interquartile Range of Hourly Wages


About This Product
Here's a great application of 6th grade math statistics skills: mean, median, and interquartile range. Students will apply their knowledge of these calculations to real-life data: the hourly wages of 10 common careers.
From a cashier to a taxi driver to an account to a CEO, students are given 10 realistic hourly wages.
First, they create a histogram to display the data. They should notice that most of the wages cluster together at the bottom end of the distribution, and one wage, the CEO, is far at the other end.
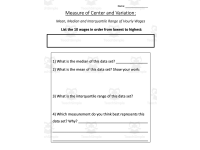
Next, they write the wages in order from smallest to largest. They use this information to calculate the mean, the median, and the interquartile range. They decide which piece of data best represents this data set.
After that, they eliminate the outlier (the CEO wage) and recalculate the same statistics. They can decide if a different piece of data now represents the set better.
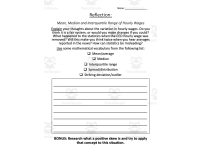
Finally, they can reflect on what they have learned about statistics and hourly wages.
A complete answer key is also included.
Grades to Use With:
This math application is designed to target 6th grade statistics learning outcomes, but this lesson could also be used in other middle grades classrooms to review these math skills or to start a discussion about income inequality and economic fairness.
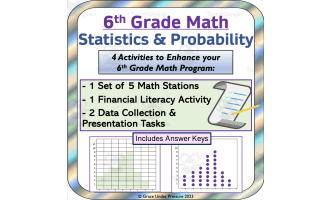
What's Included:
7 page PDF:
Title and Instructions
Hourly Wages
Histogram
2 Pages of Statistical Questions
Reflection
Answer Key
If you enjoy this product, check out other math statistics and data collection activities in my store:
Math Project: Circle Graphs and Pie Charts
Middle School Math Stations or Centers: Statistics and Probability
Line Graph Assessment: Real Life Math Problem for a Graphing Unit
Or, check out my other products about income inequality!
Critical Thinking: Income Inequality- An Integrated Math and Social Studies Lesson
Resource Tags
0 Reviews
Check out these other great products