7th Grade Statistics UNIT TEST
- Grades
- Grade 7, Middle School
- File type
- Preparation
- Print ready


- Subject
- Math, Statistics
- Topic
- statistics, probability
- Resource types
- Tests, Quizzes and Tests, Teacher Tools
- Preparation
- Print ready
About this resource
What's inside this resource
About the 7th Grade Statistics UNIT TEST
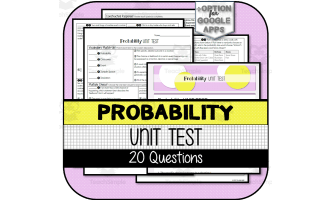
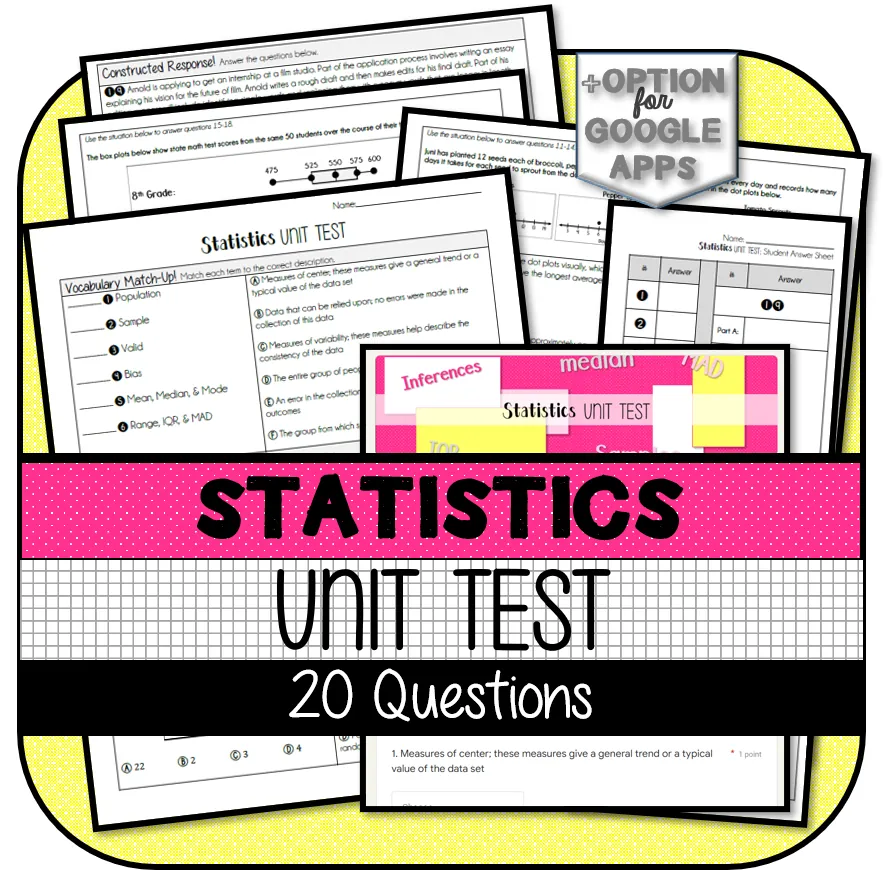
The 7th Grade Statistics UNIT TEST is a comprehensive tool designed to assess students’ comprehension of 7th grade statistics and probability concepts. It focuses specifically on the use of random sampling for population inferences.
This assessment package, equipped with a dual format, comes in both hard copy and Google Forms versions - perfectly suited for traditional classroom settings as well as online or blended learning environments.
Question Format and Distribution
- A variety of question formats such as vocabulary exercises, multiple-choice queries, and constructed response provisions.
- Inclusive of twenty questions divided into six vocabulary exercises.
- The distribution comprises: twelve multiple-choice queries, and two constructed responses.
Eco-friendly Provisions & Quick Assessment Tools:
To aid environmental-friendly practices within classrooms or homeschool environment , separate student answer sheets have been provided which works economical on printing costs. Conveniently included are answer keys with an optional scoring guide for quick assessment from educators' perspective.
Effective Usage Strategies:
This carefully crafted unit test can be used effectively not only in whole group settings but also serve well within breakout groups or assigned as standalone homework reinforcing key statistical principles assimilation. Proliferation & Value Proposition:
With its strong accordance to 7th grade statistics & probability standards, it stands out particularly towards promoting better retention about drawing comparative differences between varied populations; estimating variability between centers by expressing multiple measured variability factors thereby inseminating useful insights.
- Note:- The product usage involves specific licensing terms mitigating unauthorized sharing across digital platforms without adequate licenses hence ensuring respected Intellectual property rights are diligently respected.
Exclusive Access:
As part of stringent safety measures, the test is password-protected thereby assuring safe access limited solely to designated students on classroom/personal websites. Make your interaction with undertaking advanced statistics explorations convenient with this thoughtfully crafted resource.
The Finer Details:- Specially tailored for 7th grade math curriculum making it essential for efficient teaching-learning processes.
- Focused on the sub-discipline of statistics – a apt addition to your teaching toolkit!
Related resources
More resources teachers may find useful
24 related resources were found using this product's title, contributor, categories and tags.
In the classroom
Teaching tips & learning objectives

Learning objectives
Define key statistics vocabulary, including population, sample, bias, and validity.
Judge whether a described sampling method would produce a valid, representative sample.
Compare two data distributions shown as dot plots or box plots by visually assessing overlap and measures of center and variability.

Teaching tips
Assign the vocabulary matching section as a quick warm-up before the test, since terms like 'bias' and 'valid sample' are reused without redefinition in the later multiple-choice reasoning questions.
Use the two-up answer sheet format on page 6 to save paper -- the two constructed-response scenarios (essay sampling and NFL survey) each need extra space to show reasoning.
The optional scoring guide weights the two constructed-response questions at 8 points each, higher than any single multiple-choice item, so review sample answers with students beforehand.

Skills covered
Statistics vocabulary -- students match population, sample, bias, validity, and measures of center/variability to their correct definitions.
Sampling-method evaluation -- students judge described sampling scenarios (customer polling, essay sentence sampling) for representativeness and validity.
Data distribution comparison -- students read dot plots and box plots to compare centers, variability, and degree of visual overlap between two groups.
Good to know
Questions teachers ask about this resource
Does the test only use multiple-choice questions, or does it also require written explanations?
Both -- 18 questions are vocabulary-matching or multiple-choice, and the final two questions are multi-part scenarios (an essay-editing example and an NFL player survey) that ask students to explain their statistical reasoning in writing.
Are the dot-plot and box-plot comparison questions based on realistic classroom scenarios?
Yes -- one set uses seed-sprouting data from a garden experiment, and another uses three years of a class's state math test scores, so students compare real-feeling data sets rather than abstract numbers alone.

No reviews yet
Downloaded this resource? Tell other teachers how it went.
Curriculum
Standards, concepts & topics
Standards
 Standards
- 7.SP.A.2 — Use data from a random sample to draw inferences about a population with an unknown characteristic of interest. Generate multiple samples (or simulated samples) of the same size to gauge the variation in estimates or predictions. For example, estimate the mean word length in a book by randomly sampling words from the book; predict the winner of a school election based on randomly sampled survey data. Gauge how far off the estimate or prediction might be.
- 7.SP.B.3 — Informally assess the degree of visual overlap of two numerical data distributions with similar variabilities, measuring the difference between the centers by expressing it as a multiple of a measure of variability. For example, the mean height of players on the basketball team is 10 cm greater than the mean height of players on the soccer team, about twice the variability (mean absolute deviation) on either team; on a dot plot, the separation between the two distributions of heights is noticeable.
- 7.SP.B.4 — Use measures of center and measures of variability for numerical data from random samples to draw informal comparative inferences about two populations. For example, decide whether the words in a chapter of a seventh-grade science book are generally longer than the words in a chapter of a fourth-grade science book.
Core concepts
 Core concepts
Random sampling
Population inference
Dot plots and box plots
Measures of variability
Sampling validity
 Topics
Explore more
Categories this resource belongs to
Explore related searches
More to explore
You may also like