Line Plot Graphing Activity Math Centers Line Plots Graphs


About This Product
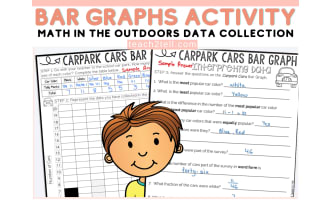
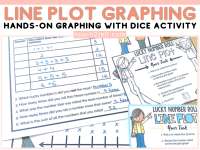
Need a practical, engaging way to teach line plots? This Line Plot Graphing Activity is a classroom-tested favorite that helps students make sense of data—by collecting it themselves. With just a six-sided dice and a pencil, your students will build a simple line plot from real results, interpret what they see, and walk away with a solid foundation in graphing skills.
Designed for Grades 1–3, this resource is perfect for introducing line plots or reinforcing graphing concepts through a hands-on math center.
Why This Activity Works
Instead of analyzing someone else’s data, students get to roll a dice 15 times, record their own results, and use tally marks and Xs to build a line plot. Then, they answer scaffolded questions to reflect on what their data shows. This simple shift—from passive to active learning—helps students understand what a line plot actually represents. It’s no longer abstract. It’s their data, their graph, their conclusions.
What’s Included:
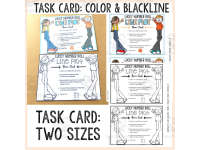
Task cards with clear step-by-step instructions (color + blackline)
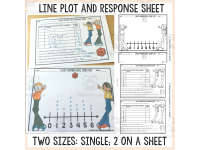
Line plot templates (single and 2-per-page formats)
Response sheets with easy-to-follow reflection questions
Sample answer key
Optional file folder cover to set up as a grab-and-go math center
Classroom Uses:
Independent math centers
Partner work
Whole-group practice
Sub plans
Fast-finisher activity
Whether you’re introducing line plots for the first time or circling back for a review, this resource keeps the process simple, visual, and meaningful. It’s low-prep, high-impact, and easy to reuse.
If you're ready to make line plots click for your students, this is the activity to start with.
Resource Tags
0 Reviews
Check out these other great products