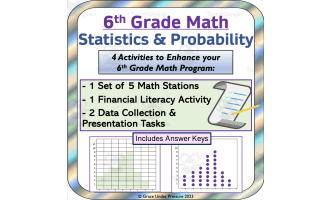
Creating Dot Plots and Histograms: 6th Grade Statistics and Graphing


About This Product
Here's a ready to go activity for students in 6th grade math class. They will collect numerical data and create their own dot plots and histograms to display their findings! This gives them a sense of ownership over their learning, and it is a great way to assess their skills!
Student Instructions:
Step 1: Think of a question with 6-8 numerical answer options. For example: ‘How many siblings do you have’ could include the answers 0, 1, 2, 3, 4, 5+
‘How long does it take you to get to school’ could include 0-10 mins, 10-20 mins, 20-30 mins, 30-40 mins, 40-50 mins, 50-60 mins, and 1hr+
Step 2: Survey at least 20 people. Record each answer with a tally mark in the right column.
Step 3: Turn your data set into a dot plot (using the provided template).
Step 4: Turn your data set into a histogram (using the provided template).
Step 5: Reflect on the process by answering discussion questions and self-assessing your skills.
Grades to Use With:
This activity is designed to target Common Core Grade 6 Math Statistics Standards, but it could also be used for enrichment in Grade 5, review in Grades 7 or 8, or in high school special education classes.
What's Included:
5 Page PDF: Title Page
Survey Data Collection Page
Dot Plot Template
Histogram Template
Reflection and Self-Assessment
If you enjoy this product, check out other math activities in my store:
Double Bar Graph Math Quiz for Grades 3-5: Differentiated
Math Project: Create Your Dream Store: Decimal Calculations and Budgeting
Financial Literacy: Vacation Math Project: Budgeting, Percentages, Time Zones and More!
Math Project: Circle Graphs and Pie Charts
Financial Literacy: My Party Budget: Decimals and Percentages Application
Math in the Real World: Personal Math Research Project for STEM Education
Geometry Project: Park Design with Area, Perimeter, and Volume
Resource Tags
0 Reviews
Check out these other great products