Make Star by Graphing Linear Equations in Two Variables



- File type
- Preparation
- Print ready


- Subject
- Math, Graphing
- Topic
- graph linear equations, fun activity
- Resource types
- Activities
- Preparation
- Print ready
- Standards
- 8.EE.B.5
About this resource
What's inside this resource
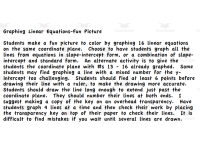
This Make Star by Graphing Linear Equations in Two Variables activity provides a fun way for students to practice graphing linear equations in two variables. Students will graph 16 eqations on the same coordinate plane. The lines graphed will make a star and then students can color their own.
Please see the pictures uploaded. There are two options for equations for students to graph. One sheet has all equations in slope-intercept form. The second sheet has half the equations in slope - intercept form and half in standard form. Students can graph using the slope and y - intercept or using the zeros of the function or a combination of both.
The equations have whole numbers, fractions, and positive and negative numbers. There are even 4 equations where the y - intercept is a fraction. You have the option of not using these equations because a sheet with those lines already graphed is included.
I suggest you, the teacher, make a copy of the key on an overhead sheet. You can then check the students every 4 to 5 lines that they graph. Students will number their lines to help you check their work and more easily identify incorrect lines. This was a favorite of my students. A great way to reinforce graphing.
Related resources
More resources teachers may find useful
24 related resources were found using this product's title, contributor, categories and tags.


In the classroom
Teaching tips & learning objectives

Learning objectives
- Graph a linear equation from its slope and y-intercept
- Graph a linear equation in standard form by plotting its x- and y-intercepts

Teaching tips
- Because students number both ends of every line, comparing their graph with the numbered answer key shows exactly which equation went wrong.

Skills covered
- Extending lines accurately — drawing each line across the whole plane so the star's points meet

No reviews yet
Downloaded this resource? Tell other teachers how it went.
Curriculum
Standards, concepts & topics
Standards
 Standards
- 8.EE.B.5 — Graph proportional relationships, interpreting the unit rate as the slope of the graph. Compare two different proportional relationships represented in different ways. For example, compare a distance-time graph to a distance-time equation to determine which of two moving objects has greater speed.
Core concepts
 Core concepts
- Linear equations
- Slope-intercept form
- Standard form
- X- and y-intercepts
- Coordinate plane
 Topics
Explore more
Categories this resource belongs to
Explore related searches
More to explore
You may also like