Independent & Dependent Variables – Hockey Math Lesson
- Grades
- Grade 6
- Pages
- 4
- File type
- Answer key
- Included


- Subject
- Math, Algebra
- Topic
- Independent variables, Dependent variables
- Resource types
- Worksheets
- Answer key
- Included
- Standards
- 6.EE.C.1
Product description
From the author
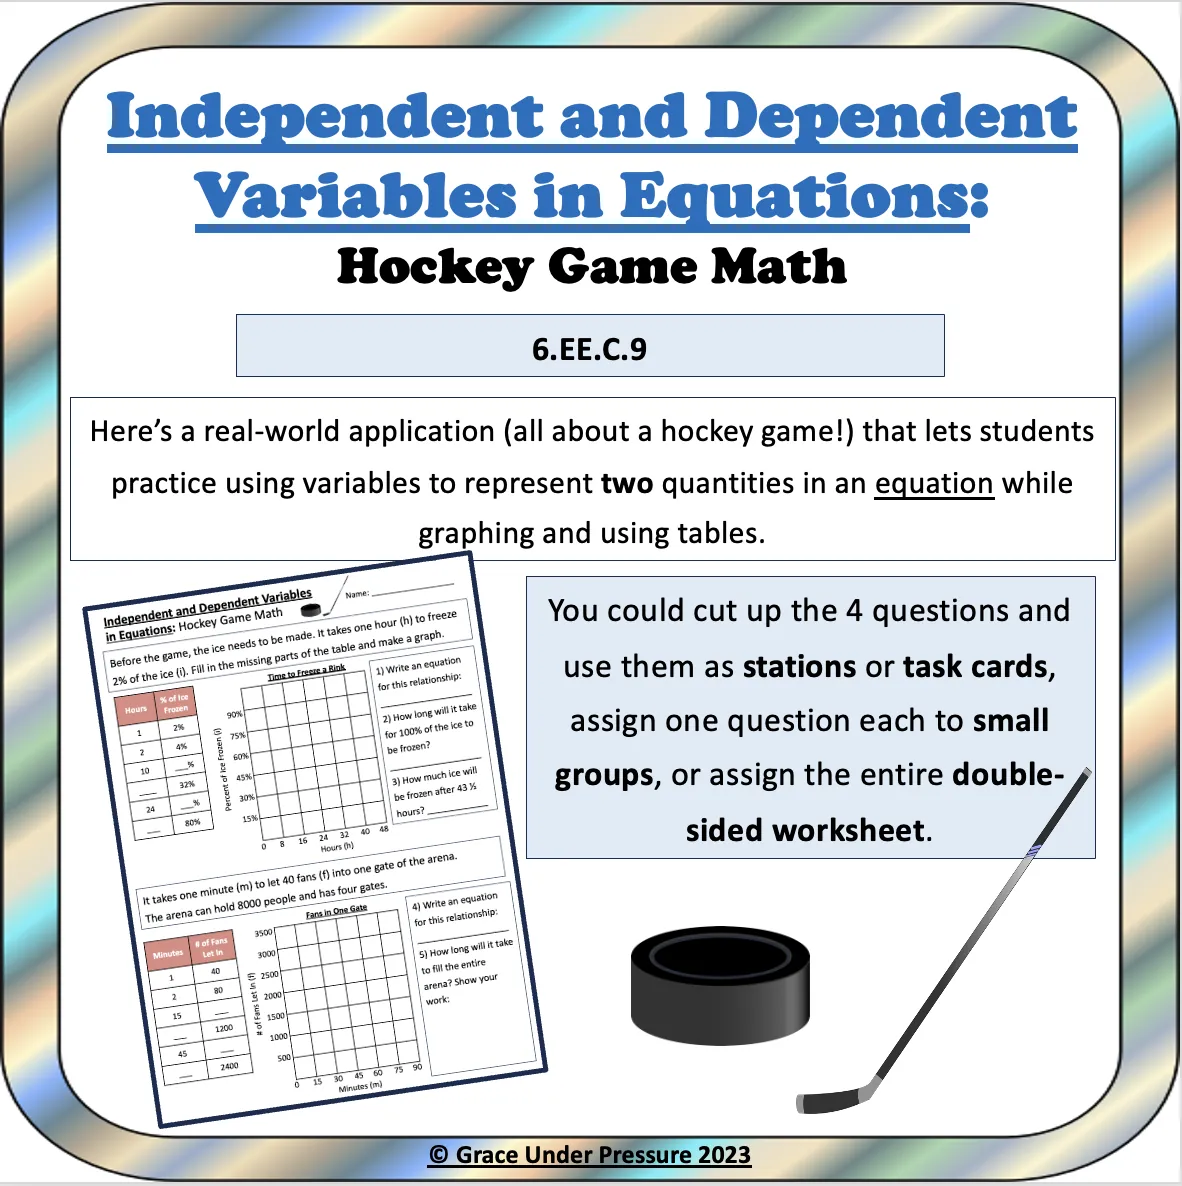
Here's a ready-to-go lesson to help show your students how learning about independent and dependent variables in grade 6 math can be helpful in the real world! This lesson is all about a hockey game and the mathematical relationships that can be found there.
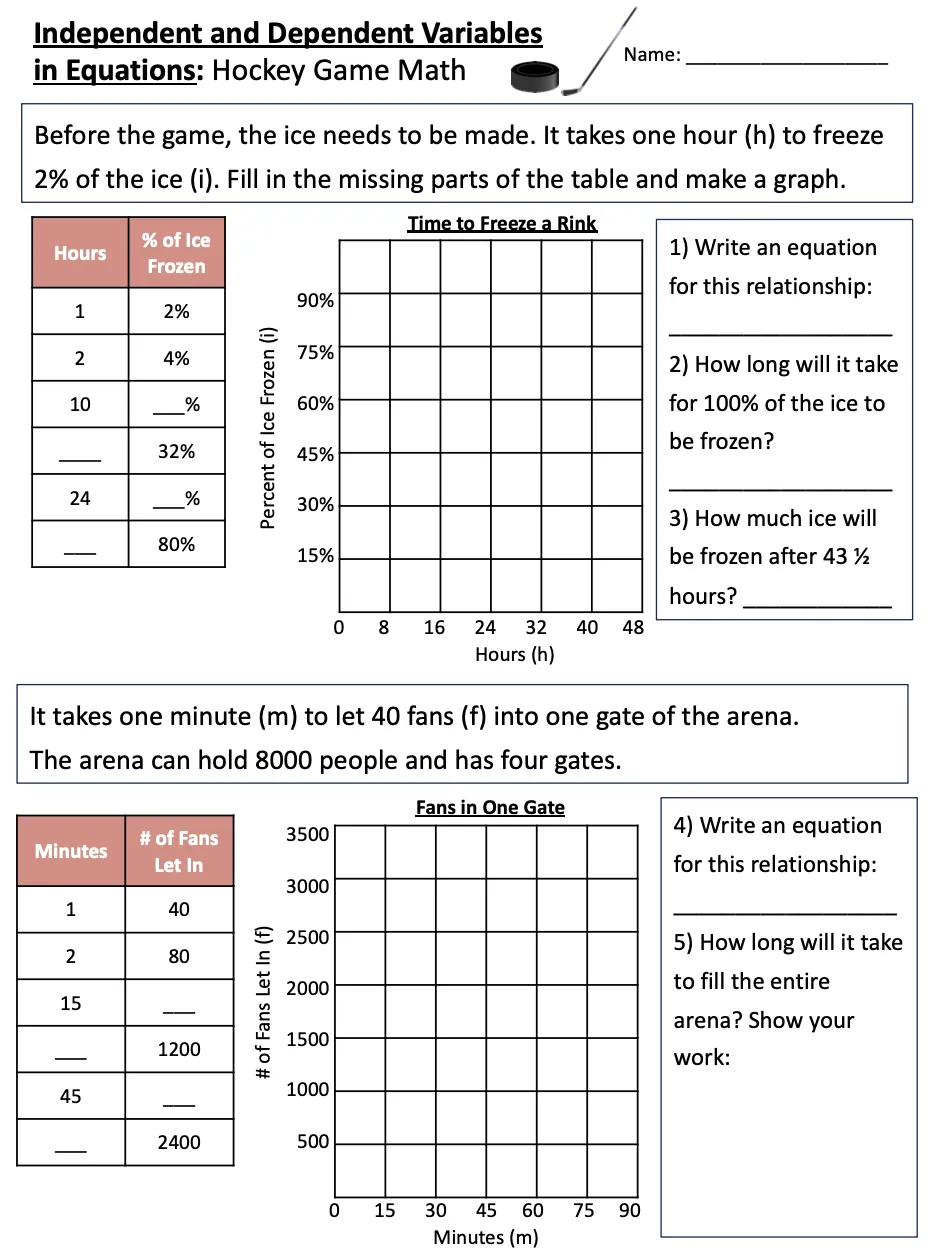
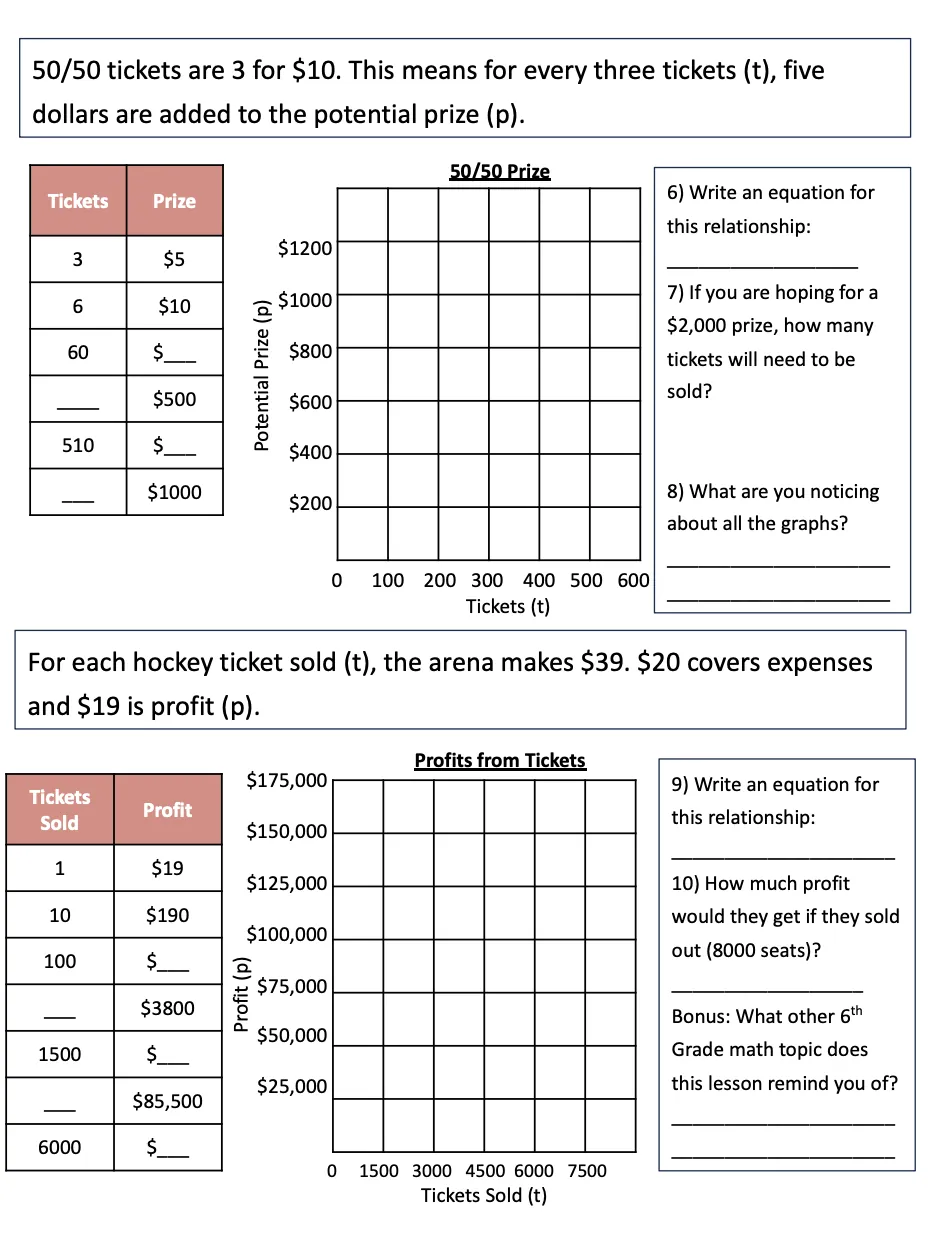
Students are given 4 scenarios about making ice, letting in fans, collecting money for 50/50 tickets, and the profits the arena makes. For each situation, they have to complete a table of values with missing entries, graph the relationship on the provided graph (labels and scales are already filled in), create an equation with the two provided variables, and answer one or two questions.
The questions increase in difficulty throughout the assignment.
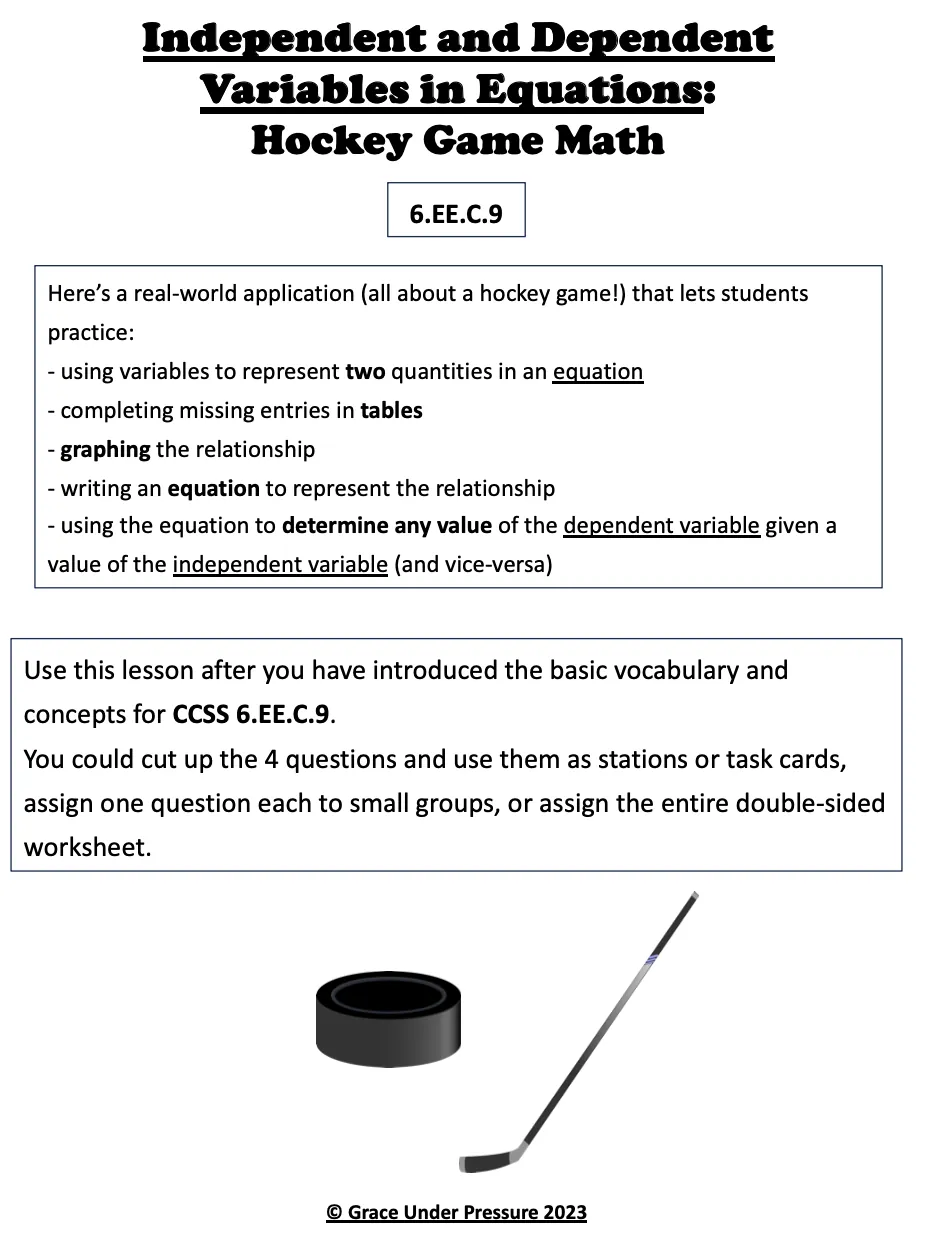
You could use this lesson in several ways. After teaching your students the basic vocabulary and concepts from your math program, you could cut the four scenarios up and use them as task cards or stations. Or, you could assign one problem each to small groups. Or, you could give each student the entire double-sided worksheet. This could even be used as an assessment!
What's included:
4 Page PDF: Title and Instruction Page
2 Pages of Student Questions
Answer page for table values, equations and written questions; completed graphs are not supplied
Grades to Use With:
This lesson is designed for students in 6th Grade who are mastering the standard 6EE.C.9. However, it could also be a great review for students in 7th or 8th grades or it could be used in high school special education classes.
Related resources
More resources teachers may find useful
24 related resources were found using this product's title, contributor, categories and tags.



In the classroom
Teaching tips & learning objectives

Learning objectives
Use two variables to represent quantities that change in relationship to one another in a real-world scenario.
Graph a relationship between an independent and dependent variable using provided labels and scales.
Write an equation that expresses a dependent variable in terms of an independent variable.

Teaching tips
Introduce the vocabulary and concepts for CCSS 6.EE.C.9 before assigning this lesson, since it is designed as practice rather than first instruction.
Cut the four scenarios apart and run them as task cards or stations instead of assigning the full double-sided sheet at once.
Use question 8, which asks students to compare all four graphs, as a discussion point about what a constant rate of change looks like visually.

Skills covered
Equation writing from a real-world rate — students translate a stated rate (like $5 added per 3 tickets) into an equation with two variables.
Table completion — students find missing values in a table by applying the same rate forward and backward.
Graphing relationships — students plot points on a pre-labeled graph to visualize how one variable changes with another.
Good to know
Questions teachers ask about this resource
How does the difficulty change across the four scenarios?
The scenarios build in complexity, moving from filling in a table and writing a simple equation in the ice-rink scenario to multi-step profit calculations and a pattern-comparison question by the ticket-profit scenario.

No reviews yet
Downloaded this resource? Tell other teachers how it went.
Curriculum
Standards, concepts & topics
Standards
 Standards
- 6.EE.C.1 — Use variables to represent two quantities in a real-world problem that change in relationship to one another; write an equation to express one quantity, thought of as the dependent variable, in terms of the other quantity, thought of as the independent variable. Analyze the relationship between the dependent and independent variables using graphs and tables, and relate these to the equation. For example, in a problem involving motion at constant speed, list and graph ordered pairs of distances and times, and write the equation d = 65t to represent the relationship between distance and time.
Core concepts
 Core concepts
Independent and dependent variables
Writing equations from tables
Graphing linear relationships
Rate of change
 Topics
Explore more
Categories this resource belongs to
Explore related searches
More to explore
You may also like