Probability UNIT TEST
- Grades
- Grade 7, Middle School
- File type
- Preparation
- Print ready


- Subject
- Math, Statistics
- Topic
- probability, unit test
- Resource types
- Tests, Quizzes and Tests, Teacher Tools
- Preparation
- Print ready
About this resource
What's inside this resource
This resource was developed to meet the requirements of the 7th Grade Statistics & Probability Standards below:
CCSS.MATH.CONTENT.7.SP.C.5
Understand that the probability of a chance event is a number between 0 and 1 that expresses the likelihood of the event occurring. Larger numbers indicate greater likelihood. A probability near 0 indicates an unlikely event, a probability around 1/2 indicates an event that is neither unlikely nor likely, and a probability near 1 indicates a likely event.
CCSS.MATH.CONTENT.7.SP.C.6
Approximate the probability of a chance event by collecting data on the chance process that produces it and observing its long-run relative frequency, and predict the approximate relative frequency given the probability. For example, when rolling a number cube 600 times, predict that a 3 or 6 would be rolled roughly 200 times, but probably not exactly 200 times.
CCSS.MATH.CONTENT.7.SP.C.7
Develop a probability model and use it to find probabilities of events. Compare probabilities from a model to observed frequencies; if the agreement is not good, explain possible sources of the discrepancy.
CCSS.MATH.CONTENT.7.SP.C.7.A
Develop a uniform probability model by assigning equal probability to all outcomes, and use the model to determine probabilities of events. For example, if a student is selected at random from a class, find the probability that Jane will be selected and the probability that a girl will be selected.
CCSS.MATH.CONTENT.7.SP.C.7.B
Develop a probability model (which may not be uniform) by observing frequencies in data generated from a chance process. For example, find the approximate probability that a spinning penny will land heads up or that a tossed paper cup will land open-end down. Do the outcomes for the spinning penny appear to be equally likely based on the observed frequencies?
CCSS.MATH.CONTENT.7.SP.C.8
Find probabilities of compound events using organized lists, tables, tree diagrams, and simulation.
CCSS.MATH.CONTENT.7.SP.C.8.A
Understand that, just as with simple events, the probability of a compound event is the fraction of outcomes in the sample space for which the compound event occurs.
CCSS.MATH.CONTENT.7.SP.C.8.B
Represent sample spaces for compound events using methods such as organized lists, tables and tree diagrams. For an event described in everyday language (e.g., "rolling double sixes"), identify the outcomes in the sample space which compose the event.
CCSS.MATH.CONTENT.7.SP.C.8.C
Design and use a simulation to generate frequencies for compound events. For example, use random digits as a simulation tool to approximate the answer to the question: If 40% of donors have type A blood, what is the probability that it will take at least 4 donors to find one with type A blood?
LICENSING TERMS: This purchase includes a license for one teacher only for personal use in their classroom. Licenses are non-transferable, meaning they can not be passed from one teacher to another. No part of this resource is to be shared with colleagues or used by an entire grade level, school, or district without purchasing the proper number of licenses.
COPYRIGHT TERMS: This resource may not be uploaded to the internet in any form, including classroom/personal websites or network drives, unless the site is password protected and can only be accessed by students.
Related resources
More resources teachers may find useful
24 related resources were found using this product's title, contributor, categories and tags.
![Functions UNIT TEST [Part 1]](https://res.cloudinary.com/teach-simple/image/fetch/f_auto,q_auto,w_260,h_160,c_pad/https://teachsimplecom.s3.us-east-2.amazonaws.com/images/functions-unit-test-part-1/image-1647655149351-1.jpg)


In the classroom
Teaching tips & learning objectives

Learning objectives
Define and distinguish probability, outcomes, event, sample space and simulation as written terms
Express the likelihood of a chance event in words and as a percentage, including the neither-likely-nor-unlikely case at 50%
Calculate the probability of a compound event by multiplying the probabilities of the independent events that make it up

Teaching tips
The Optional Scoring Guide weights the fourteen multiple-choice items at 70 of the 100 points, so a student who understands simulation design but stumbles on vocabulary still scores well — worth knowing before setting a pass mark
Question 20 needs both trial sets to be worked in order: Part B asks for the combined probability across all 40 trials, which cannot be reached without Part A's answer
The answer sheet prints two to a page and separates the constructed-response parts, so it can be handed out on its own and the question pages reused across classes

Skills covered
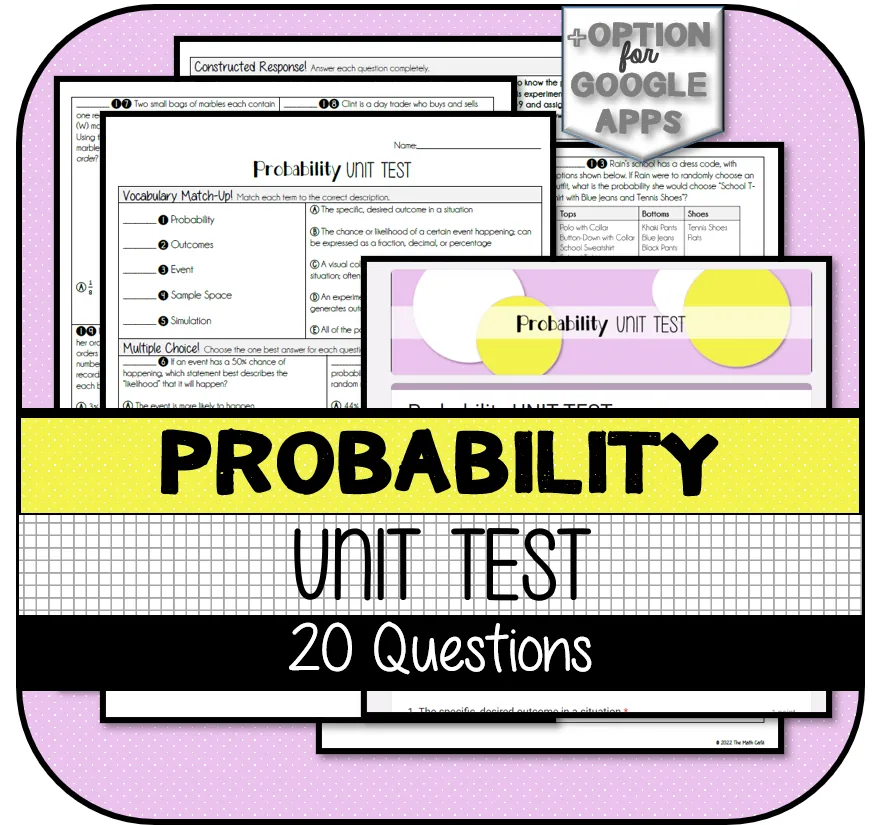
Probability vocabulary — students match Probability, Outcomes, Event, Sample Space and Simulation to written descriptions before any calculation begins.
Likelihood language — question 6 asks which statement describes a 50% chance, with certain, more likely and less likely offered as distractors.
Simple probability from a population — question 7 asks for the chance of a boy's name being drawn from a class of 14 girls and 11 boys, answered as a percentage.
Good to know
Questions teachers ask about this resource
How is the test weighted across its three sections?
An Optional Scoring Guide sets it out: the five vocabulary items are 4 points each for 20, the fourteen multiple-choice items are 5 points each for 70, and question 20 is worth 10 — 3 points each for Parts A and B and 4 for Part C. The total is 100.
What does the constructed-response question ask for?
Question 20 runs a simulation of dog ownership, with digits 0-3 standing for a dog owner and 4-9 for a non-owner. Part A asks for the probability from 20 trials of three numbers each, expressed as a percentage; Part B asks for the combined probability once a second set of 20 trials is added; Part C asks what would make the calculation more accurate.
What kinds of context do the questions use?
A mix of classroom probability tools and real-world settings. Spinners, number cubes, coins and marble bags appear alongside a day trader's 3-in-5 success rate, a coffee shop that gets 25% of orders wrong, a video game's rare fish, a school dress code and a student guessing the last three quiz questions.

No reviews yet
Downloaded this resource? Tell other teachers how it went.
Resource details
Concepts & topics
Core concepts
 Core concepts
Probability
Compound events
Sample space
Simulation
Relative frequency
 Topics
Explore more
Categories this resource belongs to
Explore related searches
More to explore
You may also like