3,931 products added recently
Fractions Test
Data Literacy & Statistics Interpretation Worksheets
Math, Addition and Subtraction, Addition, Subtraction, Algebra, Decimals, Early Math, Basic Operations, Fractions, Money, Homeschool Curriculum, Homeschool Templates, Grade 9, 10, 11, 12, Worksheets & Printables, Workbooks, Worksheets, Word Searches, Teacher Tools, Assessments, Lesson Plans, Quizzes and Tests, Quizzes, Tests
Would you like to help your students change from passive number crunchers into well-reasoned and critical thinkers? Move beyond rote memorization of the formulae and do it with this comprehensive curriculum on Data Literacy and Statistics for the 21st century designed to develop true analytical abilities. In an age of information overload, misinformation and distorted graphs, being statistically literate is no longer just a luxury; it is now an important life skill. This resource, designed as an all-in-one digital resource for high school and beginning college courses will give you everything needed to assist you in taking your students on a journey beginning with core theory and continuing on through to real-life application. This curriculum is not just another packet of math problems; it is a model for thoughtful analysis. Through engaging and relevant examples (from e-sports to medical research) and very rigorous examples, students will go beyond "what" to "why" by learning to ask the right questions about data, being aware of bias, breaking down faulty or misleading visuals and understanding the key differences between “correlation” and “causation.” Overall, this unit will help to develop and solidify the most abstract ideas into something tangible and recognizable. WHAT'S IN THE PACKAGE (A 45 PAGE PDF Document): The Basic Content/Information/Theory through the First Phase of the Course consists of: A 14-page "textbook" style document outlining the theoretical basis for the terms used to describe data. The Anatomic Scale of Data: Qualitative, Quantitative, Discrete, Continuous) includes Levels of Measurement The Descriptive Norm: Mean, Median, Mode, Variance, Standard Deviation, Interquartile Range Data visualisation and misrepresentation (Example of Anscombes Quartrant Analysing the Measurement by Each Year) Uses of Truncated Axes, The Bubble Fallacy, Probability Correlation (and Causation) Spurious Correlations Confounding Variables Phase 2: Student Workbook: Contains 10 interactive/interactive-question workbooks, 20 pages total, allows for students to apply theory Includes: Categorical vs Quantitative Data Contextualising Mean/Median/Mode Variance/Spread/Dispersion Histograms/Boxplots Correlation vs. Causation Probability/Expected Value Sampling Methodology/Bias Normal Curve (68-95-99.7 Rule)/Z Scores Margins of Error/Confidence Interval Ethics of Metrics/Misleading Statistics Visuals and Resources for the Teacher Phase 3: - Three high quality conceptual images (SVG) [of the PPDAC cycle, shapes of distributions, confounding variables]. Ideal for displaying in the classroom or giving to students as handouts. - A seven (7) page teacher answer key that not only provides the answers, but also includes pedagogical rationales for each answer to facilitate effective classroom discussions and increase comprehension of all students. This product is applicable for use in conjunction with a full unit of study for a statistics course; supplement for an Algebra 2 or Pre-Calculus class; an AP statistics review; or a homeschool curriculum. Support your students’ development of statistical literacy as a defence against data manipulation! With this product, you can help to increase the statistical literacy of your students, contributing to a data savvy world! Order now to begin creating a data savvy generation! Key Words: Data Literacy, Statistics Worksheets, AP Statistics, High School Math, Mean Median Mode, Correlation Causation, Normal Distribution, Z-Scores, Data Visualization, Critical Thinking, Real World Data, Statistics Project, Answer Key Included, Digital Resource, Printable PDF, Descriptive Statistics and Sampling Bias. Parents/Schools appreciate this product for: Real-World Critical Thinking: The curriculum helps students become good consumers of information. Students learn how to recognize deceptive story lines in reporting, flawed research, or deceptive advertising, which is critical to success in the 21st century. Everything in One Product: All of the material has been provided in one package, including theory, student worksheets, visual aids, and a teacher answer key. The result is significant time savings for teaching (by providing everything you need), while still allowing student use of all materials during class time. Making the Connection between Math and Real Life: This product uses relevant, current examples (i.e., E-Sports, crime rates, and medical research) to answer the age-old question of students, "When will I ever use this?" Promoting Deep Levels of Understanding: The curriculum pushes students to think beyond simple math calculations and instead challenges them to interpret, analyze, and justify their work. By focusing on the "why," students have a deeper understanding of the concepts, which is longer lasting. Intended Audience as Related to Statistical Concepts: Statistical Concepts such as (Z Score, Confidence Interval, Simpson's Paradox), Target Grades: Grades 10-12 - Target Grades (AP Statistics, Pre Calc, Advanced Algebra II with a Statistics Unit), would also be an excellent choice for standalone Honors Statistics Course Intro College Students - Target College Students for a STAT 101 or another introductory Statistic Courses for non-Math Majors in the social science, Business or Health Science fields Advanced Home School Students - Parent Home Schooling their High School Children would find this curriculum complete & thorough. Copyright / Terms of Use for Content : The copyrighted licensing for this book is owned by Syed Hammad Rizvi, for singular and non-commercial use only. No alterations or sales of this item or use of any part of the content on the internet is allowed. If it is necessary, then you can purchase multiple licenses from TpT to provide to your members and colleagues who are working with you as an employee, but you cannot place anything on the internet and allow it to become publicly accessible for downloading and/or use. If you would like to share this resource with other teachers, please go to Teachsimple to purchase additional licenses. Thank you for your respect of the copyright and for supporting the above terms of use. This product and resources are provided to you by Syed Hammad Rizvi.
Author Creative Book Store
Rating
Tags Statistics, DataLiteracy, APStatistics, Stats, HighSchoolMath, DataAnalysis, StatisticalAnalysis, DataScienceForStudents, Math, MeanMedianMode

Side Hustle Profit & Loss Basics
Math, Money, Multiplication and Division, Statistics, Order Of Operations, Fractions, Measurements, Time, Number Lines, Addition and Subtraction, Grade 6, 7, 8, 9, 10, 11, 12, Worksheets & Printables, Workbooks, Worksheets, Word Searches, Teacher Tools, Assessments, Lesson Plans, Quizzes and Tests, Quizzes, Tests
Transform your students' understanding of math with this engaging, real-world project on the mathematics of e-commerce! "Side Hustle Profit & Loss Basics" is a comprehensive, no-prep curriculum designed to teach teens the essential financial literacy skills needed to run a profitable online business. Gone are the days of abstract math problems. This resource bridges the gap between classroom learning and practical entrepreneurship, using relatable examples like flipping vintage sneakers ("Sneakerhead Sam") and selling handmade goods ("Jewelry Jenna"). Students will move from being passive digital consumers to analytical business operators. This project-based learning package is perfect for Math, Business, Career and Technical Education (CTE), Financial Literacy, and Homeschool settings. It systematically deconstructs the anatomy of an online sale, from calculating the cost of goods sold (COGS) to navigating complex platform fees and understanding the devastating impact of shipping miscalculations. What's Included in this 45-Page Resource: Part 1: In-Depth Lesson Guide (13 pages): A detailed teacher/student guide explaining core concepts like Revenue vs. Profit, COGS, Platform & Payment Fees (Etsy, eBay, Shopify), Logistics, Dimensional Weight, Net Profit, and ROI. Part 2: Student Workbook (18 pages): Features 10 scaffolded worksheets with over 100 questions, applying the concepts through real-world scenarios and fill-in-the-blank exercises. Worksheet 10: The Ultimate P&L Capstone Project: A final project where students synthesize all learned skills to construct a complete Profit & Loss statement for a hypothetical sneaker-flipping business. Part 3: Comprehensive Answer Key (6 pages): A full answer key for all 10 student worksheets, including the final capstone project. Part 4: Teacher-Led Visual Aids (8 pages): Includes high-quality flowcharts and diagrams perfect for classroom projection (The E-Commerce Profit Equation, Fee Matrix, Shipping Cost Matrix) and a master teacher answer key with deep-dive rationales and common student error alerts. Equip your students with the critical math and business skills they need to succeed in the modern digital economy. This isn't just a math lesson; it's a blueprint for their future financial success. Why Parents/Schools Love It: Connects Math to the Real World: It makes abstract concepts like percentages and formulas tangible by applying them to something teens are passionate about: making money online. Teaches Essential Financial Literacy: It goes beyond basic math to teach critical life skills like budgeting, cost analysis, and understanding profitability—skills not always covered in traditional curricula. Fosters an Entrepreneurial Mindset: This resource empowers students to think like producers, not just consumers, by teaching them to identify costs, manage risks, and create value. Comprehensive & No-Prep: It's a complete, ready-to-use package. The detailed lessons, student worksheets, visual aids, and in-depth answer keys save teachers and parents valuable preparation time. Target Student Audience : Based on the content and mathematical complexity, target: Primary Audience: 7th to 10th Grade students. This is the sweet spot mentioned in the PDF, and the level of math (percentages, formulas, multi-step arithmetic) is perfectly aligned with this curriculum. Secondary Audience: Advanced 6th Graders in a gifted or enrichment program. 11th and 12th Grade students in introductory Business, Economics, or Career/Life Skills classes as a practical, foundational unit. Homeschool Co-ops looking for practical, project-based learning modules for middle and high school students. Copyright/Terms of Use: This Book was copyrighted by Syed Hammad Rizvi. This resource is for personal and single classroom use only. You may not alter, redistribute, or sell any part of this resource. In other words, you may not put it on the Internet where it could be publicly found and downloaded. If you want to share this resource with colleagues, please purchase additional licenses from Teachsimple. Thank you for respecting these terms of use. This product is happily brought to you by Syed Hammad Rizvi
Author Creative Book Store
Rating
Tags Financialliteracy, Businessmath, Realworldmath, Projectbasedlearning, Entrepreneurship, Sidehustle, Ecommerce, Ppliedmath, Financialeducation, Profitandloss
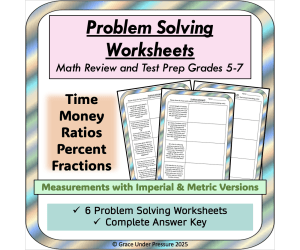
Real World Math Word Problems- Problem Solving Bundle Test Prep 5 6 7
Math, Percentages, Time, Money, Decimals, Fractions, Measurements, Multiplication and Division, Division, Grade 5, 6, 7, Tests, Quizzes and Tests, Teacher Tools, Worksheets & Printables, Worksheets, Word Problems
Grade 5-7 Problem Solving Bundle: 3 Double Sided Worksheets Here is a bundle of real world math word problems that you can use with your students in 5th, 6th, or 7th grade. The word problems cover topics including time, measurement (in both metric and imperial units), fractions, money, percentage, and more! Features: Three double-sided worksheets of problem solving questions. These activities cover essential mathematical topics including time, money, measurements (both in the imperial and metric versions), ratios, percentages, fractions and more. Great as a tool for state or provincial test preparation in both the United States and Canada. Suitable for whole class review or small group/partner discussions which foster collaborative work among students. Could be assigned as individual homework as well. How to Use: I used one doubled sided worksheet with my students each term as a way to review prior skills and practice techniques for solving word problems effectively. I would ask individual students to demonstrate how they solved a particular problem on the white board: my students love becoming the teacher and this is a great way to show that there are multiple ways to tackle the same problem. What's Included: A total of 8 pages in PDF Format: Title Page 3 Double Sided Worksheets Complete Answer Key Included Grades to Use With: These problems are specifically designed to review topics taught in grades 5, 6 and 7 math: time, money, ratio, percent, fractions, and more! If you enjoy this product, check out many other middle grades math activities in my store: Seasonal Math: Gingerbread Math: Fractions, Decimals, Percent Valentine's Day Shopping St. Patrick's Day Math Game: Whole Class Multiplication Game Math Games: Decimal Place Value Game: Tenths to Millionths Exponent Board Game Inequality Matching Game Financial Literacy: Financial Literacy: My Party Budget: Decimal and Percentages Application Financial Literacy: My Household Budget Project for Elementary Christmas or Winter Holidays Budget
Author Grace Under Pressure
Rating
Tags Problem Solving, Math Activities, Word Problems, Test Prep, Math Problem Solving, Math Word Problems, Time, Money, Measurement, Real World Math
Dyscalculia Visual Fraction Manipulatives
Math, Fractions, Addition and Subtraction, Addition, Subtraction, Graphing, Money, Number Lines, Order Of Operations, Time, Homeschool Curriculum, Homeschool Templates, Grade 3, 4, 5, 6, 7, Worksheets & Printables, Workbooks, Worksheets, Word Searches, Teacher Tools, Assessments, Lesson Plans, Quizzes and Tests, Quizzes, Tests
Change the nature of instruction for fractions, and help all students by using this complete, evidence-based guide for teaching fractions to students who may have any or all of the following: Dyscalculia, Learning Disabilities in Mathematics, or Anxiety with regard to mathematics. Are you an educator or parent looking for an effective way to teach your students with prior difficulties with abstract mathematic concepts? If so, this is the resource for which you have been searching. This is NOT just another worksheet packet. This is a complete neuro-informed intervention system built to circumvent all cognitive barriers common to the students you teach, and create true and lasting understanding of fractions that will be retained for the remainder of the student's educational career. By following the Concrete-Pictorial-Abstract (CPA) framework along with the principles of cognitive science, this guide provides students with a means for teaching fractions in a way that they will finally be able to process and master from their neurodivergent brain perspective. Your students will no longer suffer from mathematics anxiety or the "Whole Number Bias", which results in students believing that 1/8 is greater than 1/3. We use Linear Fraction Bars as a visual aid and High Contrast Visual Mapping to make fractions tangible and explainable to students through the use of their neural systems, thus enabling students to understand fractions as Predictable and Intuitive. We deliberately avoid all of the Circular Fraction Models (i.e., Pizza) that confuse students with poor or absent spatial perception. THIS 37-PAGE COMPREHENSIVE GUIDELINE CONSISTS OF: The Educators Guide: This document consists of an in-depth look at the "why" behind the method in phase one. It will include definitions of the cognitive make-up behind dyscalculia, the incorrectness of standard methods, and the architectural guidelines for creating educational tools, including manipulatives that are compatible with how the brain works. This phase will also include case studies based on individual students that can be utilized in grade-level math classes. The Student Workbook: Phase Two will consist of a sequential ten part set of worksheets that will serve as step-by-step guides for students in grades three through five. In other words, the first page of the ten page guide will help students learn what a numerator and a denominator are before they then will be a part of the worksheet on determining whether two fractions are equal or comparable. The remainder of the pages will continue to follow the same sequence, with the last page covering mixed numbers. The Teacher Resources and Visual Aids Section: This section contains all the resources necessary for teacher's to correctly implement the above two guides. In addition to possessing high-resolution diagnostic diagrams that can be utilized in the classroom, this section also contains an answer key that has been developed with pedagogical notes included, and a clinical implementation guide that contains scripted interventions for how to address common errors made by students. PLEASE NOTE THE FOLLOWING Group: Individuals who provide direct instructional support to students with disabilities and other struggles in mathematics, such as: SE Teachers/Specialists Math Interventionists/ Specialists (Tier 2 & 3) Resource Room/Co-Teach Models Tutor and Educational Therapists Homeschool Parents General Ed Teachers who want to use effective differentiation strategies. Break the cycle of poor math performance. Get your students the tools they need to develop confidence and obtain true mastery of fractions through this master guide through the Math Anxiety. Key Terms: Dyscalculia, Math Intervention, Special Education Math, Fractions, Visual Math, Manipulatives, Math Anxiety, Learning Disabilities, Third, Fourth, Fifth, Grade, Homeschooling, RTI, Math Support, Number Sense, *CPA Framework (Concrete, Picture, Abstract) Teacher’s Guide. Reasons Why Parents/Schools Are Enthusiastic About This Resource: Evidence Based and Neuro-informed: This is truly not just a collection of activities but rather a structured program based on cognitive science; designed specifically to help students whom have dyscalculia. Eliminates Math Anxiety: The clear, visual, step-by-step approach removes uncertainty and abstract confusion which builds student confidence and creates a positive attitude ("I can do math") about math. Comprehensive All-In-One System: The complete package allows educators to save a tremendous amount of time in planning. It contains the theoretical document, the workbook (student-facing) as well as the full answer key that contains additional clinical cues. This resource is ready for immediate use as an intervention resource. Promotes True Understanding, Not Just Rote Memorization: By making fractions physical and visual, this program goes beyond mere memorization of rules and fosters true, deep conceptual understanding, which can be applied to future concepts. Highly Targeted for Intervention: This resource is an excellent Tier 2/3 resource for intervention, special education resource rooms, tutoring, and homeschooling. It provides very powerful and focused support, right where struggling learners require it most. An in-depth analysis of the content, research, and worksheets indicates the primary target audiences are: Special Education Teachers: This is a critical instructional support for teachers within this specialty since the resource was designed specifically for students diagnosed with learning disabilities. Math Interventionists: This resource meets the needs of small groups of students (Tier 2 and Tier 3) who are considerably below grade level in mathematics. Educational Therapists and Tutors: Qualified professionals who provide one-on-one support to students with dyscalculia. Homeschooling Parents: Especially for those children who have a diagnosis or possibly math deficits. Targeted Grade Levels: The component will specifically target grades three, four and five because all of the fractions address fundamental fractions through to adding fractions and mixed numbers, which are all taught at these grade levels. Rewriting Terms: All rights reserved. The author has copyright (Copyrighted by Syed Hammad Rizvi) on this work. A teacher may use this resource for his/her classroom and for private individual use. You may not modify this resource, distribute it, or sell it. You may not publish or make it available on the internet. If you would like to share this resource with your colleagues, please buy additional licenses from Teachsimple. Thank you for being honest and following my copyright terms. This product is made with love by Syed Hammad Rizvi.
Author Creative Book Store
Rating
Tags Dyscalculia, Dyscalculiaresources, Dyscalculiasupport, Mathintervention, Visualmath, Mathmanipulatives, Mathlearningdisability, Specialneedsmath, Neurodivergentlearning, Cpaframework

Data Science Fundamentals for Kids - Statistics book
Statistics, Math, Time, Money, Measurements, Fractions, STEM, Homeschool Curriculum, Grade 4, 5, 9, 10, 11, 12, Projects, Activities, Lesson Plans, Teacher Tools, Outlines, Quizzes and Tests, Tests, Worksheets & Printables, Workbooks, Word Problems
Unleash the fascinating world of data science and statistics for children with "Data Science Fundamentals for Kids - Statistics" by Syed Hammad Rizvi. Featuring a detailed 370-page course manual tailored specifically for students from grades 5-12, this invaluable resource simplifies complicated concepts into a series of fun and easy-to-master tutorials. Starting with introductory elements of data types and sources and progressing all the way from advanced concepts of probability studies to visual representation techniques of pictographs, bar graphs, line graphs, pie charts, histograms, and box plots, measures of central tendency of mean, median, and mode statistics, dispersion of range, quartiles, and interquartile range, sampling techniques with simple and stratified sampling methods, concepts of correlation and causality, responsible uses of statistics and ethics in statistics studies, and applied examples of AI and big data statistics analysis, this statistics guide for kids helps instill crucial STEM knowledge for their. Perfect for homeschooling students, this statistics guide for kids also makes for a stellar choice for teachers and scholars seeking resources for statistics learning for children, guidebooks for beginner-level analysis of statistics and frequency analysis for students, books for kids related to STEM information, and resources for probability tutorials for middle school Why Parents/Schools Love It: Engaging and Age-Appropriate Content: Makes use of interesting stories and engaging examples to ease kids into otherwise frightening subject matter involving statistics, thereby giving kids a confidence boost in STEM fields. Comprehensive Skill Building: Encompasses all aspects of analysis from data acquisition to ethical analysis. Aiding students for future AI/data science employment purposes as well as for test preparation. Hands-On Tools/Projects: Includes guides with specific steps for creating illustrations for graphs, calculations for measures of variation, and completion of mini-projects. Encourages Critical Thinking: Teaching the importance of being unbiased, the difference between correlation and causation, and responsible data use helps prepare individuals for the data-intensive world that is the future of business and society. Flexible for Any Learning Style: Can be used for individual study, teaching groups, or supplementing a curriculum, with examples that show statistical principles in sports, games, and real life. Target Grades : Based on the complete analysis of the content, structure, and progression of the book-from very foundational concepts such as "What is Data?" and some simple tally marks in early chapters to more advanced ones like interquartile range, probability laws, sampling bias, correlation scatter plots, and ethical AI implications in later chapters-I believe the book addresses students from grades 5 through 12 most appropriately. The material progresses from simple, kid-friendly explanations using real-life analogies-such as recipes for data organization-to more sophisticated ideas, such as data skewness and mini data projects. As such, it is well-suited for middle schoolers, grades 5-8, who need to study visualization and averages, while high schoolers, grades 9-12, will appreciate the subjects of inference, causation, and what the future of technology holds based on these subjects. It is neither too simplistic for older children nor too advanced for younger ones, and the logic of progression allows for progressive learning. Copyright/Terms of Use This Book is copyrighted to Syed Hammad Rizvi. This resource is intended for home/personal use only. There shall be no changes, modifications, redistributions, or sales of this resource. In other words, it shall not be placed on the Internet where it might be accessible for downloading. “If you’d like to share this resource with fellow teachers, you are able to do so through purchasing additional licenses from Teachsimple.” Este producto llega felices a ofreceros por Syed Hammad Rizvi
Author Creative Book Store
Rating
Tags StatisticsForKids, DataScienceForChildren, STEMEducation, KidsStatisticsBook, DataFundamentals, ProbabilityForKids, DataVisualizationForBeginners, MeanMedianMode, EducationalBooksForKids, Grades5to12