3,936 products added recently
Statistics Test

Crypto & Digital Money Literacy (Age-Appropriate Intro)
Math, Statistics, Money, Order Of Operations, Business, Life Studies, Career, Finance, Coaching, Home Economics, Homeschool Curriculum, Grade 7, 8, 9, 10, 11, 12, Worksheets & Printables, Workbooks, Worksheets, Word Searches, Teacher Tools, Assessments, Lesson Plans, Quizzes and Tests, Quizzes, Tests
This complete curriculum on the topic of Cryptocurrency and Digital Currency Literacy is a NO-PREP curriculum to prepare your students for the 21st Century's economy as it relates to Cryptocurrency and Digital Currency! This 40-page resource will transform your students from passive consumers to critical thinkers. This curriculum will guide students through the complex world of blockchain, Web3, and digital assets using an academically rigid and unbiased basis. Each student must understand the technology, economics, and history so that they can build a solid foundation on which to build their financial future. The curriculum is appropriate for high schools, and advanced middle schools to study Economics, Computer Science, Business, Financial Literacy, and Social Studies. By removing the speculative hype around these topics and focusing on first principles, this curriculum will provide students with the necessary tools and skills to understand, analyze and critique the "next generation" of the internet. WHAT'S IN THIS 40-PAGE RESOURCE: Part One: The Core Academic Framework (4 Chapters) Chapter One: The Evolution of Value; Barter and Rai Stones to Fiat Currency Chapter Two: The Architecture of Trust; Deconstructing Blockchain, Cryptography & Distributed Ledgers Chapter Three: Programmable Money; Smart Contracts and DeFi Chapter Four: Economics, Ethics & The Future; Volatility, CBDCs and Global Impact Part Two: Student Workbook (10 Worksheets) Over 90 Questions to Test Critical Thinking and Comprehension Historical Antecedents, Decentralized ledgers, Cryptography, Bitcoin & Scarcity, Smart contracts, Digital wallets & Custody, Tokenomics, Scams/Risk Mitigation, Regulation and the Future of Web3 Part Three: Teacher Resources & Visuals (3) High Quality Visuals; Presentations/Explaining Immutable Blockchains, Network Topologies, and the Public/Private Key Analogy Detailed Teacher Implementation Guide; 4 Week Suggested Lesson Plan, Recommendations for Pedagogy and Cross Curricular Instruction (Math, Civics, CS) Comprehensive Answer Key; 10 Page Answer Key with Full Detail and Answered Questions for each Workbook Question and each Chapter Reflection This Curriculum is a Great Resource to Help Students Develop a Strong Foundation of Future Proof Understanding of One of The Greatest Technological Shifts of Their Lifetime. Help Your Students Become Truly Digitally Literate! Keywords: The financial literacy curriculum around the world focuses on Cryptocurrency, Blockchain, Bitcoin, The Digital Currency Age, Web3, High School Economics, Computer Science, Low/no-prep resources to support education in Cryptocurrencies and Digital assets without the risk of speculation, DeFi/NFT technologies - Smart Contracts, 21st Century Skills for educators. Why Parents/Schools Love It: Fosters Critical Thinking Not Speculation: This curriculum teaches students the "How" (the technical side of they did this) and the "Why" (the economic principle behind it), not just teaching students risk to the financial markets through investment advice. Completely No-Prep & Turn-Key: This curriculum will save teachers time because all they have to do is print the lessons, engaging worksheets, high-quality visuals, etc., along with a complete answer key, and be ready to teach on a very complex topic. Builds Essential 21st Century Skills to Prepare Students for their Future: Students will learn more than just financial literacy because they will understand the digital economy and decentralized economy they will be inheriting so they are prepared to become good citizens and productive members of society in the future. True Neutral and Academically Rigorous Perspective: The materials are presented neutrally and educationally, and use real-world case studies and historical context in order to provide a neutral and sophisticated understanding of this polarizing topic. Integration of Many Subjects: This is not merely a technology curriculum; it incorporates lessons from History (Evolution of Money), Civics (CBDC vs. Private Currency), Economics (Scarcity, Inflation), and Computer Science (Cryptography, Logic), etc. Target Student Audience: According to the PDF document, this content is meant for grades 7-12; however, after considering the complexity of the material, a more detailed breakdown can be made as follows: - Primary Target: for students in grades 9-12 (high school). The material presented such as the Byzantine Generals Problem, Turing Completeness, Tokenomics, and Regulatory Arbitrage are all concepts that align with and can be understood by the cognitive level of high school students; thus this material fits perfectly within offerings of honors/ap economics, principles of computer science or as a course under the financial technology branch. - Secondary Target: for advanced/gifted students in 7-8 grades (middle school). The use of this material in the standard/mainstream classroom curriculum may not be appropriate for 7th grade students; however, it would be beneficial in some cases (i.e. gifted program, after school technology club) where there is evidence of interest and ability toward this subject. Copyright to this Book is with Syed Hammad Rizvi and is provided solely for personal use or in one class per teacher. No part of this Book can be changed, copied, shared, or sold. You may not post this Book on the internet for anyone else to find or download. If you wish to give a copy to fellow teachers, please purchase additional licenses from Teachsimple. Your cooperation and respect for these terms of use are greatly appreciated. Thank you for your contribution to this project by Syed Hammad Rizvi.
Author Creative Book Store
Rating
Tags FinancialLiteracy, Cryptocurrency, Blockchain, Bitcoin, Web3, DigitalCurrency, DigitalAssets, DeFi, SmartContracts, DecentralizedFinance

Goal Setting & Financial Independence Planners
Economics, Social Studies, Math, Statistics, Money, Order Of Operations, ELA, Reading, Strategies, Reading Comprehension, Grade 6, 7, 8, 9, 10, 11, 12, Teacher Tools, Assessments, Lesson Plans, Quizzes and Tests, Quizzes, Tests, Worksheets & Printables, Workbooks, Worksheets, Word Searches
With "Goal Setting & Financial Independence: The Architect's Blueprint", you will turn your students from passive consumers to future architects of their own financial success. Unlike most personal finance worksheets, this curriculum is designed specifically for high school and advanced middle school (Grades 8-11) students and provides them with the respect and knowledge necessary to thrive in today's economy. Say goodbye to condescending advice and oversimplified budgeting. The Curriculum explores the psychology of wealth, the mathematics of compound interest, and the strategic frameworks of top-level corporate strategists and investors. Budgeting as you know it is redefined as Strategic Resource Allocation, and students learn how to be the Chief Financial Officer (CFO) of their own life. Your students will get to create real-world cases, work through 10 detailed worksheets and find themselves on the road to implementing action plans that will help them achieve their goals. Subjects Discussed Are: The Psychology of Creating Goals and Identifying Habits Time-Money Relationship: The Impact of Compounding(72) Budgeting for Success through the Zero-Based Method Learning About Your Paycheck (Gross vs Net Income), FICA Tax/Withholdings/W-4? Difference between Good and Bad Debt, Credit, Amortization Teenage Investing: Roth Individual Retirement Accounts (IRAs), Index Funds & Dollar Cost Averaging (DCA) Evaluating Career and College Return on Investment Asymmetrical Risk - How to Build Human Capital through Entrepreneurship. TEENS AND THE FIRE MOVEMENT - Financially Independent Retire Early. This resource provides : educators with a comprehensive curriculum complete with four chapters covering the key principles of Personal Finance, Financial Literacy and Basic Money Management as well as a Student Workbook containing ten worksheets designed to allow students to create their own personal financial blueprint through multiple scenarios, calculations and reflection questions. The Teacher Resources (Visual Aids) are designed to provide educators with visual representations of the key topics covered in each of the four chapters so that the students can better understand these concepts through the use of anchor charts and an Answer Key for all objective type questions, along with a grading rubric for the subjective type questions. This resource can be used in various academic settings including: Personal Finance Classes/Electives, Economics Classes, Life Skills, Career Readiness Courses and Homeschool Co-Ops. This resource has been created to allow educators to design a complete instructional program that will give students the most valuable lesson they will ever learn and that is how to achieve Financial Independence. Keywords: Financial literacy; Personal Finance; High School; Middle School; Life Skills; Economics; Investing for Teens; Budgeting Worksheet; Goal Setting; Compound Interest; FIRE Movement; Career Readiness; College ROI; Digital resource; Printable; PDF; Curriculum; Homeschool; Case Study Method. Educational Benefits For Parents And Schools-Alike: More Than Just Basics: They will not only learn how to balance a check book, but will also learn about many other advanced financial strategies and 21st Century Financial Concepts relating to Investments, Career Return on Investment Analysis, and the Psychology of Wealth Building. Rigorous & Respectful; Curriculum uses behavioral economics and psychology to build a sophisticated vocabulary with a work related context, assumes that teenagers are intelligent individuals and builds and creates a database of excited students. Turn Key: Provides a detailed curriculum and 10 student assignment work sheets; Free Power Point Presentation; Student Manual; Teacher Manual; Complete Answer Key; complete Grading Rubric The "do-it-yourself" or upload method provides zero prep time for the instructor. Action-oriented & Practical: Students learn all of the aspects of financial literacy through case studies and hands-on experience with developing and developing their own personal goals, personal budgets, and long-term financial plans. Based on the analysis done : on the stated criteria, the cover lists the suggested audience to be Grades 8-11. This is an accurate portrayal of the grades as they apply to target audience. Grades 8 and 9: The concepts of goal-setting, identity-based habits, zero-based (simple) budgeting, and receiving a first paycheck all apply directly to this age group and may provide challenges (some, yet, not many); however, the material has enough scaffolding (additional content and/or support) to be very effective. Grades 10 and 11: This represents the best fit. These students are considering securing part-time employment, intending to save money for an automobile, or making major decisions concerning attending college or entering into the workforce. The worksheets provided on the topics "ROI (Return on Investment) Comparison of College vs. Career," "Dynamics of Debt," and Roth IRA will be extremely relevant and pertinent to these students. High School teachers of Personal Finance, Economics, and Life Skills. Instructors of Career and Technical Education (CTE). Parents who choose to home school and desire to use the material as a strong, legitimate financial curriculum. Middle School teachers of students that are classified as advanced or are placed into gifted programs. Terms of Use and Copyright: This book is copyrighted by Syed Hammad Rizvi. It is intended for use only by the individual or a single school classroom. No part of this resource may be altered, re-distributed or resold. In other words, you cannot post on the internet in a public place so that it can be found and downloaded. If you would like to share this resource with colleagues, please purchase additional licenses from Teachsimple to do so. Thank you for abiding by our terms of use. Syed Hammad Rizvi, thanks for bringing your amazing product.
Author Creative Book Store
Rating
Tags FinancialLiteracy, PersonalFinance, HighSchoolTeacher, LifeSkills, Investing, Budgeting, TeacherResources, FinancialEducation, Economics, CareerReadiness
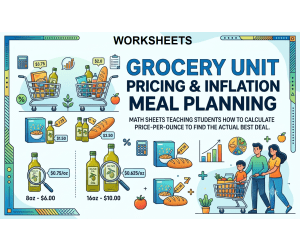
Grocery Unit Pricing & Inflation Meal Planning
Math, Addition and Subtraction, Addition, Subtraction, Early Math, Numbers, Place Value, Measurements, Money, Statistics, Grade 6, 7, 8, 9, 10, 11, 12, Worksheets & Printables, Workbooks, Worksheets, Word Searches, Teacher Tools, Lesson Plans, Quizzes and Tests, Quizzes, Tests, Assessments
Are you bored of hearing "When am I going to use this?" in your math class? Here is a realistic math project that should help! It will change the grocery store into a fun, practical laboratory and give your students the skills needed in their lives. The mini-unit "Grocery Unit Pricing & Inflation Meal Planning" is a complete, no-prep resource to keep students engaged, excited, and working with their math skills. Students won't be sitting in the class just learning theoretical division and percentage problems. They will become smart consumers that will learn to recognize marketing tricks, be aware of inflation, and take quality financial decisions. The 10 worksheets along with clear guides will help students learn how to calculate unit prices and find better prices. WHAT'S INSIDE (47-PAGE FILE): Section One: The Economics of the Aisle (11 pages) An in-depth theoretical resource for educators (or highly skilled undergraduate pupils) on the fundamentals of unit pricing, shelf placement psychology, concepts such as the "Bulk Buying Fallacy" and other inflation-related phenomena, as well as the concept of shrinkflation, which refers to the price increase of a product in real terms. Section Two: Student Workbook (17 pages) 10 Different Worksheets: A carefully designed experience from basic math concepts to intricate and multi-step calculations Worksheet 1: The Fundamentals of Unit Pricing Worksheet 2: Buying Issues in Bulk (Does Bigger Always Mean Better?) Worksheet 3: The "Sale" Falsehood (Finding the True Discount) Worksheet 4: Becoming a Shrinkflation Detective Worksheet 5: Comparing Price Tag Direct and Private Labels Worksheet 6: Measuring Liquid and Estimate the Cost Worksheet 7: Calculation of Fruits and Vegetables Prices Worksheet 8: Including Household Wastage (The True Bulk Cost) Worksheet 9: Meal Planning with an Increased Budget Worksheet 10: Grocery Store Challenge (The Final Workbook Health Check) Content of Part 3: Visual Education Material & Teachers’ Assistance Resources (19 pages) Essential Visuals: Three professionally designed diagrams for printing (Anatomy of a Price Tag, Unit Price Decision Tree, and Shrinkflation Explained) ideal for classroom posters and students’ materials. Thorough Answer Key: In-depth explanation of solutions for all 10 worksheets. Teacher Implementation Guide: A must-read guide comprising: Suggestions on how to motivate students to study. Information on how to deal with the most common mistakes students make. Sample 5-day period of implementation. Information about how to modify the lessons for both students who require more time to master the material and pupils who get the topic. Reasons why Parents/Schools are Attracted to It: The math lesson comes to life, removing doubts about any potential usefulness. Math has been connected to real life – children experience first-hand how maths-related skills are employed in stores. Raising financial literacy is also hard to underestimate. For example, students get to develop certain life skills relevant to future everyday life, such as budgeting and recognizing economic processes. The unit contains all the necessary resources for teachers, leaving no effort to them. The unit includes a teacher's guide, plenty of tips for differentiation, and an answer key. Relevant and exciting content. The idea of “outsmarting the advertisers” and becoming a “shrinkflation detective” is inspiring for kids, awakening their interest in the topic. No mundane tasks; tasks require analytical thinking and drawing conclusions based on the data/figure. Intended Student Groups: Because of its use of math concepts (decimal division, rounding to thousandths, percent of increase/decrease, multiple operations), this PDF can be successfully implemented in the following classes: Primary Audience: Middle school students (grades 6-8). The content will completely meet the curriculum standards regarding decimal systems, ratios, proportions and percentages. Academic Programs for the Secondary Audience: High school classes on Life Skills/Consumer Mathematics; this is a great hands-on unit for older students who are studying budgeting and independent life. High school classes on Financial Literacy; this is an introductory unit on economics. Advanced students in grade 5; this material can serve as an extension or be utilized in talented and gifted programs. Co-ops for Homeschoolers; this is a useful real-life project easily adaptable to multi-ages. Copyright/Conditions of Use: Copyright of this book is owned by Syed Hammad Rizvi. This resource is intended for one person and single use in one classroom. There is no modification, reproduction or selling of this resource. Put simply, it cannot be uploaded on the internet where it can be publicly accessed and downloaded. If you need to share this resource with your colleagues, please acquire more licenses from Teachsimple. Thank you for complying with our terms of use. This product is proudly presented to you by Syed Hammad Rizvi
Author Creative Book Store
Rating
Tags RealWorldMath, FinancialLiteracy, ConsumerMath, MiddleSchoolMath, UnitPrice, ProjectBasedLearning, MathProject, 7thGradeMath, 8thGradeMath, LifeSkills
Career Exploration – Skills Matching & Resume Builders
Math, Statistics, Money, Career, Life Studies, Coaching, Business, Finance, Home Economics, Leadership, Homeschool Curriculum, Homeschool Templates, Grade 9, 10, 11, 12, Worksheets & Printables, Workbooks, Worksheets, Word Searches, Teacher Tools, Assessments, Lesson Plans, Quizzes and Tests, Quizzes, Tests
Unlock Your Students' Potential Using The Ultimate Career Exploration And Resume Builder Unit Are you finding it difficult to have your students honour their value by turning their life experiences into an exciting and valuable resume to apply to college / their first job? This 45-page complete unit has no prep required for you because it will transform your students' perception of writing a resume (which can be an overwhelming task) into the experience that they discover of who they are and create a professional brand for themselves. This is more than just a resume template. There is an entire pedagogical framework that is created for our modern high school student (Grades 10-12). This framework teaches beyond just formatting; it teaches the critical thought process of how to create a powerful resume. Thus allowing your students to articulate their abilities and accomplishments with confidence. WHAT DOES THIS 3-PHASE PROGRAM INCLUDE? Phase 1: Core Principles and Paradime Shift of Resume Writing - This phase focuses on the purpose behind writing resumes as it relates to what the learner can expect in regard to outcomes. This will require learners to deconstruct previous experiences, define their hard, soft, and transferable skills, and understand the psychological impact of creating a successful resume. Utilising real-world case studies, this phase helps students to develop a better understanding of concepts learned. Phase 2: Step-by-Step Student Workbook - Students will complete ten step-by-step worksheets that will help them create a plan of action using the following worksheets: The Comprehensive Skills Inventory (self-assessment of their skills); Mapping Your Ikigai (finding where you fit between what you love, what the world needs, and what you can be rewarded for); Job Description Forensics (decoding the job description to find out what the employer is really looking for); Forging the Professional Summary (creating a strong elevator pitch); Academic & Extracurricular Translations (how to turn project work in school and hobbies into professional accomplishments); The STAR Method & Action Verb Activation (writing strong bullet points with evidence); Career Non-Negotiables (establishing your values as they relate to long-term career satisfaction); Skill Gap Analysis (creating a plan for future growth and development); The Master Resume Architect (conducting one final and quality check of the resume). Phase 3: Teacher Resources & Visuals - All of the resources you need to successfully execute this phase of the program are contained here! 3 Professional Visuals/Anchor Charts to be used as teacher presentation/learning tools and classroom displays (Skill Translation Chart, Resume Overall Anatomy Chart, The STAR Method Chart). Diagnostic Rubric & Answer Key: The use of detailed rubrics showing what 'Unacceptable', 'Developing' and 'Exemplary' work looks like enables you to be much fairer to students when grading their subjective work than merely saying "yes/no". Great for: CTE (Career, Technical, Education) classes Life Skills or AVID programs Persuasive writing (English Language Arts) units Advisory/homeroom College/career readiness counseling Provide confidence and resources for students to become leaders. Download this amazing unit right now! This Curriculum offers a clear narrative about 'no experience' through effective strategies. 1. No experience to a strong story - learn to translate everyday activities such as sports, part-time jobs and babysitting into a powerful, high-impact, professional language for college admissions officers and hiring managers. 2. Step-by-step and actionable - these 10 structured worksheets take students from confused to confident and provide tangible, high-quality resumes at the end of the process. 3. Built for teachers - includes a complete answer key and diagnostic rubrics to use when grading, removing the guesswork & making this essential life skills easy to teach. 4. Teaches modern, real-world practices and principles - this curriculum is current and teaches critical modern concepts such as how to optimize resumes for Applicant Tracking Systems (ATS), using the STAR method in interviews, and developing a professional digital footprint. The target grade levels for students to use this book include: The terminology used in the text, e.g., "semiotics", "metamorphosis", "pedagogical framework", actually defines the grade levels we should focus on when developing a curriculum for preparing for college and nursing school applications and internships. 10th grades: it is an excellent year to be introducing students to these very important concepts 11th grades: this is the best time to teach these very important skills; at this time, the student is getting ready to apply for school. 12th grades: it is absolutely critical and very beneficial to help students refine and perfect their applications and resumes as they leave school. Additionally, this could also be a useful resource for college freshmen who need help developing their very first resume for clubs and internships while in college. Copyright notice/Terms of Use: This Book was copyrighted by Syed Hammad Rizvi. You can use this resource for personal and single classroom use. You are not allowed to change, give away, or sell any part of this product. You may also not post this on the Internet, where it can be publicly accessed, downloaded, etc. If you wish to share this with your colleagues, you will need to purchase an additional license from Teachsimple. Thank you for your cooperation with these terms of use. Syed Hammad Rizvi presents this product!
Author Creative Book Store
Rating
Tags ResumeWriting, CareerExploration, ResumeBuilder, HighSchoolTeacher, CollegeAndCareerReadiness, JobSkills, LifeSkills, CollegePrep, BusinessEducation, AdvisoryPeriod
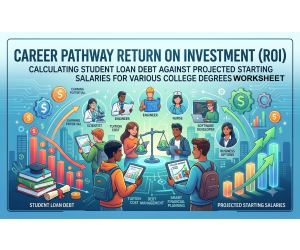
Career Pathway Return on Investment (ROI)
Math, Statistics, Order Of Operations, Money, Measurements, Resources for Teachers, Classroom Management, Community Building, Special Resources, Life Skills, Homeschool Curriculum, Homeschool Templates, Grade 8, 9, 10, 11, 12, Worksheets & Printables, Workbooks, Worksheets, Word Searches, Teacher Tools, Assessments, Lesson Plans, Quizzes and Tests, Quizzes, Tests
Is your student truly prepared for the biggest financial decision of their life? Don't let them fall into the "passion trap" or get mesmerized by prestigious university brochures without understanding the numbers. This comprehensive, no-prep digital curriculum is the most important lesson your high schooler will receive on college and career planning. This 40-page PDF guide and workbook transforms students into the "Chief Financial Officer" of their own future. By applying real-world math and economic principles, students will move from being passive consumers of education to active architects of their financial independence. This resource is a complete mini-unit, broken down into three essential phases: Part 1: The Theoretical Framework: An 11-page "textbook" section that clearly explains complex financial topics in an easy-to-understand format. Topics include: Return on Investment (ROI) for college degrees. The mechanics of student loans (Subsidized vs. Unsubsidized). The "silent killer" of wealth: Interest Capitalization. Gross Income vs. Net (Take-Home) Income. The crucial "Rule of First-Year Salary." Calculating the Debt-to-Income (DTI) ratio. Strategic alternatives like the 2+2 transfer model, trade schools, and scholarships. Part 2: The Student Workbook: Ten detailed worksheets that build on each other to move from theory to practical application. Students will calculate actual costs, analyze debt scenarios, budget monthly payments, and compare the financial outcomes of different career paths (e.g., STEM vs. Arts). Part 3: Visuals & Teacher Resources: Includes three powerful visual aids (bar chart, ROI matrix, and flowchart) for classroom discussion, plus a full Teacher Answer Key for all worksheets, making this a completely no-prep resource for you! Who is this for? This is a must-have resource for teachers of: Personal Finance Economics College and Career Readiness (AVID, etc.) Math (real-world applications) Life Skills High School Counselors and Advisors Homeschooling parents preparing their teens for college. Equip your students with the critical thinking and financial literacy skills they need to make smart, informed decisions that will prevent a lifetime of debt and set them on a path to true financial freedom. Download today and empower your students for a secure future! Keywords: Financial Literacy, Personal Finance, Student Loan Debt, College ROI, Return on Investment, College and Career Readiness, High School Math, Economics, Budgeting, Debt-to-Income Ratio, AVID, Life Skills, Workbook, Project Based Learning, No Prep, Teacher Answer Key, Grades 9, 10, 11, 12. Why Parents/Schools Love It : Empowers Students with Real-World Math: It moves beyond abstract theory and uses concrete calculations that directly apply to a student's immediate future, making learning engaging and relevant. Prevents Catastrophic Financial Mistakes: This single resource can arm a student with the knowledge to avoid tens, or even hundreds, of thousands of dollars in unmanageable debt, providing an immeasurable return on investment for the family. Comprehensive and No-Prep: It’s a complete, self-contained unit. With a textbook, 10 worksheets, visuals, and a full answer key, a teacher or parent can implement it immediately without any additional planning. Builds Critical Thinking & Ownership: It teaches students to think like a "CFO," analyzing data, weighing risks, and making strategic decisions, fostering a sense of responsibility for their own financial well-being. Balances Passion with Practicality: The guide doesn't discourage students from following their dreams; instead, it gives them the tools to finance those dreams intelligently, ensuring their passion doesn't become a "financial prison." Target Audience : Based on the content, vocabulary, and concepts discussed (e.g., FAFSA, college selection, majors), target: Grades: 9th through 12th Grade students. 9th/10th Graders: Excellent for introducing these concepts early, so they can plan their high school courses and activities (like scholarship searching) strategically. 11th/12th Graders: Absolutely critical, as they are actively making these decisions. This resource provides an immediate, practical tool for their real-life choices. Courses: Personal Finance, Economics, College & Career Planning, AVID, Advisory/Homeroom periods, and any Life Skills class. Copyright/Terms of Use: This Book was copyrighted by Syed Hammad Rizvi. This resource is for personal and single classroom use only. You may not alter, redistribute, or sell any part of this resource. In other words, you may not put it on the Internet where it could be publicly found and downloaded. If you want to share this resource with colleagues, please purchase additional licenses from Teachsimple. Thank you for respecting these terms of use. This product is happily brought to you by Syed Hammad Rizvi
Author Creative Book Store
Rating
Tags FinancialLiteracy, PersonalFinance, StudentLoans, StudentDebt, CollegeROI, MoneyManagement, FinancialEducation, Budgeting, DebtFree, DebtFreeJourney
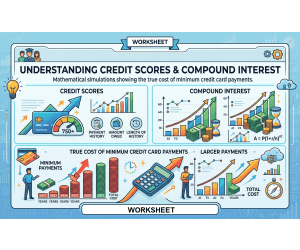
Understanding Credit Scores & Compound Interest
Research, Math, Money, Statistics, STEM, Classroom Management, Resources for Teachers, Community Building, Order Of Operations, Number Lines, Grade 6, 7, 8, 9, 10, 11, 12, Worksheets & Printables, Workbooks, Worksheets, Word Searches, Teacher Tools, Assessments, Lesson Plans, Quizzes and Tests, Quizzes, Tests
Are your students prepared to tackle the intricate financial challenges that will face them in the future? Don't stop at checkbook balancing; equip them with skills that would prepare them for financial success. This complete financial literacy curriculum - "Understanding Credit Scores & Compound Interest: The Invisible Architecture of Modern Wealth" - is an engaging and ready-to-use module aimed at turning high school students into active financial participants. More than just a vocabulary lesson, this module delves into two of the most powerful driving forces of economic mobility - the FICO score and compound interest. Students will be presented with rich data, real-life examples, and challenging tasks during this learning experience. What This 42-Page Comprehensive Guide Contains: Part 1: Basic Principles (11 Pages): Detailed authorial chapters that convert complicated ideas into simple and interesting teachings. Chapter 1: The Credit Score Structure: Five fundamental aspects of FICO score, credit usage, and the actual effect of the credit score. Chapter 2: The Concept of Compound Interest: Formula for growth, the 72 rules, and the major difference between annual percentage rate and annual percentage yield. Chapter 3: The Link Between Credit and Interest: Examples of the impressive monetary losses connected with low credit score. Chapter 4: Practical Wealth Building and Debt Reduction: Effective tools such as utilizing the grace period, "Authorized User" loophole, and avoiding the minimum payment استراتيجية. Part 2: Students’ Manual (19 Pages): 10 worksheets intended for learning and application of the information. Great material for individual work, team discussions, or assignments. Includes all types of calculations, tasks for analysis of the examples, and prompts for critical thinking on various subjects such as going into the debt (avalanche vs. snowball) and making credit from scratch, the real cost of low payments, and the concluding assignment where the students develop their ten-year financial plan. Part 3: Instructor Materials (12 Pages): Everything you require for the successful execution of this unit and time savings in preparing. 3 Visual Representations created by Professionals: Excellent graphics that show the FICO scoring model, the compound interest exponential curve, and the credit and debt cycle. 5-Day Implementation Guide for Teachers: A complete teaching manual with pacing, goals and objectives, topics for discussions, and educational methods. Extensive Answer Key: A complete answer key which has answers to all 10 worksheets, values and sample answers for analytical queries. Why Are Students and Educators Fond of This Curriculum? Equips with Marketing Skills needed in Real Life: This course goes beyond theory providing such knowledge of finance that will help the youth not to end up in debts and be able to make good use of all financial opportunities. Excellent and Interesting Academic Experience: The course understands the importance of financial education as an academic field. The serious approach, case studies, and difficult tasks make students think rather than memorize word for word. Provides a Ready-to-Use Solution: It is an easily accessible program to deal with. The 5-day teacher's manual to the course is accompanied by the visual aids and answer key enabling teachers to save lots of time. Gives Students a Strong Life Start: It is not just an exam, but a step to a successful future life giving students understanding of how to earn money, manage income and build up a good credit score. Target Audience: According to the complex vocabulary, mathematical concepts (compound interest formula), and real-life examples (college students, first cars, retirement planning), the main audience is: Primary Audience: High School Students (Grades 11-12). Subjects this lesson will be well suited for: Personal Finance, Economics, Life Skills, Consumer Math, Business, and any teacher like to include practical real-life knowledge to his classes. Secondary Audience: Freshmen or Homeschooling co-ops learning practical life skills. This content has been copyrighted by Syed Hammad Rizvi. This content can only be used for personal use and single classroom purposes. This content should not be modified, duplicated, or sold. To clarify further, this content can never be posted on the internet for public access. In case you would like to share this content with your colleagues, kindly purchase more licenses from Teachsimple.
Author Creative Book Store
Rating
Tags FinancialLiteracy, PersonalFinance, CompoundInterest, CreditScore, FICOscore, WealthBuilding, FinancialEducation, Investing101, DebtFreeJourney, MoneyManagement
Evaluating Open Source Evidence (OSINT)
Math, Measurements, Money, Statistics, Time, Business, Life Studies, Finance, Career, Home Economics, Grade 6, 7, 8, 9, 10, 11, 12, Worksheets & Printables, Workbooks, Worksheets, Word Searches, Teacher Tools, Assessments, Lesson Plans, Quizzes and Tests, Quizzes, Tests
Transform your students from passive consumers of information into sharp, critical digital investigators! In an age of corporate greenwashing and slick marketing, this comprehensive curriculum on Open Source Intelligence (OSINT) equips high school students with the essential skills to pierce the veil of public relations and uncover factual truth. This is not your average media literacy lesson. This is a deep dive into the real-world tools used by journalists and investigators to hold powerful entities accountable. Students will learn to navigate complex public databases, deconstruct corporate narratives, and synthesize evidence to form their own reasoned conclusions. Move beyond discussing "fake news" and empower your students to actively verify information using primary source data from the SEC, EPA, OSHA, and more. This complete, no-prep unit is perfect for Civics, Economics, Media Literacy, Journalism, and AP-level courses. It's meticulously structured into three phases: Introduction & Methodology: Four engaging chapters that build the theoretical foundation of corporate OSINT, introducing key databases and the C.O.R.E. investigative methodology. Student Workbook: Ten rigorous worksheets, including a final capstone investigation, that turn theory into practice. Students will tackle real-world scenarios, analyze mock press releases, and get hands-on experience with database research. Teacher Resources: Everything you need to teach with confidence, including visual aids (flowcharts and diagrams), a comprehensive answer key with model answers and grading rubrics, and a detailed Teacher Implementation Guide covering pacing, instructional strategies, and crucial ethical frameworks. Equip your students with the 21st-century's most vital skill: the ability to think critically and verify everything. Keywords: Media Literacy, OSINT, Open Source Intelligence, Critical Thinking, Digital Citizenship, Fact-Checking, Corporate Accountability, High School, Research Skills, Civics, AP Government, Economics, Journalism, Fake News, Primary Source, Data Analysis, SEC EDGAR, EPA, Project-Based Learning, No-Prep, Curriculum. Why Parents/Schools Love It: Builds Real-World Skills: This curriculum teaches practical, 21st-century skills in critical thinking, data analysis, and digital verification that are directly applicable to college, careers, and informed citizenship. Comprehensive & Teacher-Friendly: It is a complete, ready-to-use package with student-facing material, visual aids, and a robust teacher guide with answer keys and rubrics, saving educators dozens of hours of prep time. Promotes Ethical Digital Citizenship: The dedicated "Ethical Frameworks" section ensures students learn to use these powerful skills responsibly, focusing on verification and accountability, not online vigilantism. Engaging & Relevant Content: Students investigate timely, relevant issues like environmental claims ("greenwashing") and labor practices, making learning more dynamic and impactful than a standard textbook. Cross-Curricular Application: Its versatile design allows it to be seamlessly integrated into multiple subjects, including Social Studies, English Language Arts, and even STEM, making it a valuable resource for an entire school. Target Audience Analysis : Based on the advanced vocabulary ("epistemological," "fiduciary duty"), complex subject matter (SEC filings, lobbying disclosures), and the explicit "Teacher Implementation Guide" on page 33, this PDF is targeted at: Grade Level: Advanced High School (Grades 10-12) and potentially introductory College/University students. The guide mentions 8th grade, but the content is most suitable for older, more mature students. Specific Classes: AP Government / Civics: Perfect for units on corporate influence, lobbying, and regulatory agencies. Economics: Excellent for analyzing corporate finance, risk, and the gap between marketing and financial reality (Form 10-K). Media Literacy / Digital Citizenship: A cornerstone unit for teaching students to be critical consumers and verifiers of online information. Journalism: An essential, practical toolkit for aspiring investigative reporters. Advanced English / Rhetoric: A fantastic resource for analyzing non-fiction texts (corporate PR vs. legal filings) and understanding persuasive strategies. Computer Science: Can be used in a data literacy or data ethics context, teaching students how to query and interpret structured data from public databases. Copyright/Terms of Use: This Book was copyrighted by Syed Hammad Rizvi. This resource is for personal and single classroom use only. You may not alter, redistribute, or sell any part of this resource. In other words, you may not put it on the Internet where it could be publicly found and downloaded. If you want to share this resource with colleagues, please purchase additional licenses from Teachsimple. Thank you for respecting these terms of use. This product is happily brought to you by Syed Hammad Rizvi
Author Creative Book Store
Rating
Tags OSINT, OpenSourceIntelligence, MediaLiteracy, FactChecking, DigitalLiteracy, CorporateAccountability, VerifyingSources, OSINTforEducation, InvestigativeJournalism, DataLiteracy

Side Hustle Profit & Loss Basics
Math, Money, Multiplication and Division, Statistics, Order Of Operations, Fractions, Measurements, Time, Number Lines, Addition and Subtraction, Grade 6, 7, 8, 9, 10, 11, 12, Worksheets & Printables, Workbooks, Worksheets, Word Searches, Teacher Tools, Assessments, Lesson Plans, Quizzes and Tests, Quizzes, Tests
Transform your students' understanding of math with this engaging, real-world project on the mathematics of e-commerce! "Side Hustle Profit & Loss Basics" is a comprehensive, no-prep curriculum designed to teach teens the essential financial literacy skills needed to run a profitable online business. Gone are the days of abstract math problems. This resource bridges the gap between classroom learning and practical entrepreneurship, using relatable examples like flipping vintage sneakers ("Sneakerhead Sam") and selling handmade goods ("Jewelry Jenna"). Students will move from being passive digital consumers to analytical business operators. This project-based learning package is perfect for Math, Business, Career and Technical Education (CTE), Financial Literacy, and Homeschool settings. It systematically deconstructs the anatomy of an online sale, from calculating the cost of goods sold (COGS) to navigating complex platform fees and understanding the devastating impact of shipping miscalculations. What's Included in this 45-Page Resource: Part 1: In-Depth Lesson Guide (13 pages): A detailed teacher/student guide explaining core concepts like Revenue vs. Profit, COGS, Platform & Payment Fees (Etsy, eBay, Shopify), Logistics, Dimensional Weight, Net Profit, and ROI. Part 2: Student Workbook (18 pages): Features 10 scaffolded worksheets with over 100 questions, applying the concepts through real-world scenarios and fill-in-the-blank exercises. Worksheet 10: The Ultimate P&L Capstone Project: A final project where students synthesize all learned skills to construct a complete Profit & Loss statement for a hypothetical sneaker-flipping business. Part 3: Comprehensive Answer Key (6 pages): A full answer key for all 10 student worksheets, including the final capstone project. Part 4: Teacher-Led Visual Aids (8 pages): Includes high-quality flowcharts and diagrams perfect for classroom projection (The E-Commerce Profit Equation, Fee Matrix, Shipping Cost Matrix) and a master teacher answer key with deep-dive rationales and common student error alerts. Equip your students with the critical math and business skills they need to succeed in the modern digital economy. This isn't just a math lesson; it's a blueprint for their future financial success. Why Parents/Schools Love It: Connects Math to the Real World: It makes abstract concepts like percentages and formulas tangible by applying them to something teens are passionate about: making money online. Teaches Essential Financial Literacy: It goes beyond basic math to teach critical life skills like budgeting, cost analysis, and understanding profitability—skills not always covered in traditional curricula. Fosters an Entrepreneurial Mindset: This resource empowers students to think like producers, not just consumers, by teaching them to identify costs, manage risks, and create value. Comprehensive & No-Prep: It's a complete, ready-to-use package. The detailed lessons, student worksheets, visual aids, and in-depth answer keys save teachers and parents valuable preparation time. Target Student Audience : Based on the content and mathematical complexity, target: Primary Audience: 7th to 10th Grade students. This is the sweet spot mentioned in the PDF, and the level of math (percentages, formulas, multi-step arithmetic) is perfectly aligned with this curriculum. Secondary Audience: Advanced 6th Graders in a gifted or enrichment program. 11th and 12th Grade students in introductory Business, Economics, or Career/Life Skills classes as a practical, foundational unit. Homeschool Co-ops looking for practical, project-based learning modules for middle and high school students. Copyright/Terms of Use: This Book was copyrighted by Syed Hammad Rizvi. This resource is for personal and single classroom use only. You may not alter, redistribute, or sell any part of this resource. In other words, you may not put it on the Internet where it could be publicly found and downloaded. If you want to share this resource with colleagues, please purchase additional licenses from Teachsimple. Thank you for respecting these terms of use. This product is happily brought to you by Syed Hammad Rizvi
Author Creative Book Store
Rating
Tags Financialliteracy, Businessmath, Realworldmath, Projectbasedlearning, Entrepreneurship, Sidehustle, Ecommerce, Ppliedmath, Financialeducation, Profitandloss
Investing Fundamentals & Compound Interest Practice Pack
Math, Money, Statistics, Measurements, Order Of Operations, Trigonometry, Time, Multiplication and Division, Division, Multiplication, Grade 6, 7, 8, 9, 10, 11, 12, Worksheets & Printables, Workbooks, Worksheets, Word Searches, Teacher Tools, Lesson Plans, Quizzes and Tests, Quizzes, Tests, Assessments
Complete Set: Compound Interest Practice Pack. With this no-preparation, complete unit, you’ll transform your students’ passive consumption of investments into sound capital allocation. Looking for something more than just a “piggy bank” way to teach your students about finances? The curriculum is designed specifically to teach students how and why they can create wealth through investing. It breaks down stocks and stock markets into simple components, demonstrates how inflation erodes purchasing power without anyone being aware, and mathematically proves the power of compounding through real-life practice examples. Students will develop a firm understanding of investing based upon the learning experiences included in this program, which can be used for multiple subject areas including Math, Economics, Personal Finance, and Life Skills. This is an excellent resource for several weeks of instruction on investment literacy as it provides all of the necessary ingredients (theory, practice, and case studies) to achieve successful learning outcomes. WHAT WILL YOU FIND IN THIS 32-PAGE PACK? PHASE ONE: Core content and theory – This section includes a 9-page “student textbook” that communicates the foundational concepts using academic terminology, generalized real-world analogies where applicable. Covers the following topics: The reality of inflation; the asset classes (i.e., stocks, bonds reals); the difference between simple versus compound interest; the Rule of 72; risk and diversification; behavioral finance (e.g., loss aversion, fear-of-missing-out [FOMO]); and dollar-cost-averaging. PHASE TWO: Student workbook (10 sheets) - A total of 13 pages worth of rigorous practice questions. Starting with simple terminology and building to an increasingly sophisticated portfolio synthesis. Worksheet #1 – The anatomy of an investment. Worksheet #2 –The time-value-of-money and inflation. Worksheet #3 – Simple versus compound interest. Worksheet #4 – The compound-interest formula in action. Worksheet #5 – The Rule of 72. Worksheet #6 – Risk, reward, and volatility. Worksheet #7 – Stock-market mechanics. Worksheet #8 – Mutual funds and ETFs. Worksheet #9 – The impact of time (early vs. late). Worksheet #10 – Building your first portfolio. PHASE THREE: Visual and teacher resources – Everything you need to properly teach and support your students on the curriculum. 3 impactful pedagogical visuals that can be projected and/or printed relating to compound interest, asset classes, and the Rule of 72. Complete, step-by-step Teacher’s Answer Key covering all ten questions in the workbook. Sound implementation guide for Teachers, including module pacing, instructional notes, and other valuable insights related to “expected cognitive friction points.” This isn't simply a lesson plan; This is an entire educational program that will teach young people to have real financial intelligence. Key Terms: Teach Teenagers How to Invest, Compound Interest Project, Financial Literacy Curriculum, Personal Financial Literacy Unit, Stock Market For Kids, Middle School Math, High School Economics, Homeschooling, No Preparation Needed (Print and Go), Digital Learning, and Money Management. Why Do Parents and Schools Appreciate It? Provides Life-Long Knowledge: This unit provides students with the knowledge and skills needed to understand investing, create wealth, and achieve financial stability beyond what they learned in textbooks. Total Unit; No Additional Preparation Needed: This is a complete curriculum with everything needed, including theory, worksheets, visuals, answer keys, and a teacher guide! By using this complete package, more than 10-20 hours of planning can be saved by teachers. Real Comprehension: By combining theory with real-life examples and thorough practice, this unit gives students the knowledge they need to know how to calculate for financial growth and what risks are associated with financial growth rather than just memorizing formulas to solve for financial growth. Engaging as well as Challenging: The language in this unit is challenging, but when students use the step-by-step format and apply these concepts to real-life examples (like comparing two different investors), students will find these topics very interesting and easy to understand. Target Student Audience Assessment: A comprehensive assessment of the material's content and language, mathematical difficulty, etc.: Grade Level of Main Target Audience: 8 - 10 grades. Although the PDF shows 7-9 grades, the vocabulary/academic terminology in the document is more suitable to eighth (8th) & ninth (9th) graders (as opposed to seventh (7th) graders). The level of math skills required to understand this material would be appropriate for eleventh (11th) and twelfth (12th) graders as an introductory course to economics or mathematics. Additional Targeted Audiences: Gifted and Talented Middle School Students (6-7 grades) High School Economics or Personal Finance Electives (11-12th grades) - Use This Material As An Introductory Unit Parents Who Homeschool Their Children With A Curriculum Focused On Life Skills Or Financial Literacy This Product has been copyrighted by Syed Hammad Rizvi. You may only use this Resource in your Personal Use, and only in a Single Classroom. This means you cannot alter, redistribute, or sell it. In other words, you cannot put this Resource on the Internet, where others can access and download it permanently or temporarily. If you would like to share this Resource with your colleagues, please purchase additional licenses from Teachsimple. Thank you for your understanding, and thank you for complying with these terms of use. Syed Hammad Rizvi is pleased to provide this Product to you.
Author Creative Book Store
Rating
Tags FinancialLiteracy, CompoundInterest, Investing, PersonalFinance, StockMarket, WealthBuilding, MoneyManagement, InvestingForBeginners, RuleOf72, TimeValueOfMoney

Money Management – Budgeting & Saving Worksheets
Math, Money, Statistics, Early Math, Numbers, Addition and Subtraction, Addition, Subtraction, Measurements, STEM, Homeschool Curriculum, Homeschool Templates, Grade 4, 5, 6, 7, 8, Worksheets & Printables, Workbooks, Worksheets, Word Searches, Teacher Tools, Assessments, Lesson Plans, Quizzes and Tests, Quizzes, Tests
Are you ready to go further than just a simple "piggy" bank lesson and actually give your students the skills they need for the real world? This complete, integrated Money Management Unit is filled with lots of tools to develop your students into well-rounded, professional "Young Scholars" by learning how to use the basic concepts of applied microeconomics in creative ways that meet the unique developmental abilities of both upper elementary and middle school students. The Money Management Unit is not a pack of worksheets; it is a full set of easy-preparation teaching materials that will help you develop a lasting understanding of financial literacy within your students. By using a structured, three-phase approach, this resource will help students gain a better understanding of the more complicated topics related to making good choices when it comes to spending or saving money through the use of opportunity cost; and will give them all the tools they need to manage the way they spend or save their money, from using an allowance to saving up for something they want to buy (zero‐based budget). WHAT'S AVAILABLE IN THIS SET OF 33 PAGES OF MATERIAL: PHASE 1: The Textbook: Applied Microeconomics for Young Scholars: A comprehensive but user-friendly resource for learning about many topics related to economics. The textbook covers the following topics: Income and Outflow: What is an allowance? What is entrepreneurship (using the example of a lemonade stand)? What's the difference between Needs and Wants? Budgeting Strategies: How do you use a "Zero-Based Budget" and the Spend, Save, and Share Approach? The Psychology of Saving: Delayed gratification, SMART goal setting, and the math of compound interest. The Economics of Choice: Understanding opportunity cost and consumer traps (e.g., Gamified Value in in-app purchases). PHASE 2: Student Workbook (10 Rigorous Worksheets): Worksheets which reinforce the concepts presented in the Textbook. Students are provided an opportunity to practice through hands-on activities in the areas of: Analyzing Revenue and Expenditures Making Decisions about Needs versus Wants Creating and Balancing a Ledger Calculating Savings Goals and Timelines Evaluating Opportunity Cost Recording Daily Transactions Understanding Emergency Funds and Unit Pricing Final Project: Create a Budget from Scratch! Phase 3: Teacher Resources (Visual Aids & Answer Key) 3 Visual Aids That Are Clear & Easy To Use! Perfect on a smart board or printed poster style (or printed out as handouts), these three docs provide simple visuals of how to create a budget, set goals and make impulse purchases so that students can see their financial decisions. An Answer Key Containing All Calculations & Rationale Is Ready For Use! A full key has been created for each of the ten worksheets so grading each student work will be easy. These two items can be used by any classroom and a great teaching resource to provide math centres, economics unit, life skills classes or by parents who want to give their child an early advantage through financial literacy. Why do Parents/Schools love: - The unit not only gives students the mechanics of counting money but explores how to think about money by teaching about core economic principles (opportunity cost, behavioral economics). - The entire unit is in one PDF file and provides a full resource package (textbook, 10 worksheets, various visual aids and full answer key). All materials are ready to print and teach - no planning time is wasted! - Students will have exposure to real-world experiences that will help them to connect abstract concepts to their everyday life through relatable case studies and scenarios such as saving for sneakers, managing their allowance & avoiding getting trapped in the arcade. - The psychology behind financial decisions is addressed and students are provided with tools for delayed gratification, goal setting (S.M.A.R.T.) and impulse control which will serve them throughout their lives. - The unit provides a wide range of options that can be tailored for any type of student. The rigor of the lesson is appropriate for gifted programs while the clear structure and answer key provides a high level of support for whole-group lessons or independent learning. Target Market (Student Classes): Based on the content's terminology ("applied microeconomics", "cognitive architecture") and concepts addressed, the following target audiences should be: Primary Target Market: Students in 5th and 6th Grade. The material is abstract in nature and at the appropriate developmental stage of maturation for these grades, as addressed in the Introductory Section provided in the PDF. Secondary Target Market: Gifted students in 4th Grade who are capable of handling advanced concepts and vocabulary. The material will provide them with a challenge while stimulating their interest. Tertiary Target Market: Students in 7th and 8th Grade that have never received an introduction to or have already been remediated in Financial Literacy concepts. The unit provides excellent foundational material for students enrolled in Life Skills and/or Economics courses. Niche Target Market: Families who homeschool their children and desire to use an academic, complete, and structured Financial Literacy Curriculum. Copyright / Terms of Use: This Book is the intellectual property of Syed Hammad Rizvi and all rights are reserved. This resource is intended for private use and only in single classroom settings. You may not create any modifications to this resource, redistribute it or sell any part of it. Additionally, you may not make this resource available on a publicly accessible internet website. If you are interested in sharing this resource with your colleagues please be sure to purchase additional licenses from Teachsimple . Thank you for helping to protect the terms of use stated above. This resource has been produced by Syed Hammad Rizvi, who takes great pleasure in providing this resource to teachers!
Author Creative Book Store
Rating
Tags FinancialLiteracy, MoneyManagement, PersonalFinance, Budgeting, SavingMoney, Economics, TeachingMoney, MoneySkills, FinanceForKids, BudgetingForKids

Gig Economy Taxes & 1099 Forms
Math, Money, Statistics, Resources for Teachers, Classroom Management, Community Building, STEM, Special Resources, Life Skills, Social Emotional Learning (SEL), Grade 6, 7, 8, 9, 10, 11, 12, Worksheets & Printables, Workbooks, Worksheets, Word Searches, Teacher Tools, Assessments, Lesson Plans, Quizzes and Tests, Quizzes, Tests
Are your students babysitting, driving for DoorDash, selling on Etsy, or freelancing online? They're not just earning money—they're running a business. Prepare them for the real world of independent work with this comprehensive, no-prep unit on Gig Economy Taxes and the 1099-NEC form. This resource is expertly designed to bridge the gap between abstract economic theory and the immediate financial realities facing today's teens. Move beyond basic budgeting and empower your students with the critical knowledge to avoid the dreaded "tax shock" that derails so many young entrepreneurs. This is a must-have for any Personal Finance, Economics, Business, Entrepreneurship, or Career & Technical Education (CTE) class. WHAT'S INCLUDED IN THIS 44-PAGE RESOURCE: Part 1: In-Depth Textbook (10 Pages): A clearly written guide that deconstructs complex topics into understandable concepts. Chapters Cover: The Anatomy of a 1099 Contractor, Demystifying the Self-Employment Tax, The Mechanics of Personal Withholding, and Strategic Deductions. Real-World Case Studies: Follow "Maya the Digital Freelancer" and "Leo the Neighborhood Landscaper" to see the concepts in action. Part 2: Student Workbook (10 Rigorous Worksheets): A complete set of independent practice worksheets that build from foundational knowledge to complex synthesis. Worksheets Cover: W-2 vs. 1099 Paradigm, Anatomy of the 1099-NEC Form, Calculating Self-Employment Tax, Estimated Quarterly Taxes, Strategic Deductions, Budgeting, The Penalty Trap, State Tax Variables, Record-Keeping, and a final Capstone Scenario synthesizing all skills. Part 3: Teacher & Visual Resources: Everything you need to teach with confidence. High-Contrast Visual Aids: Three professional diagrams perfect for classroom projection (Self-Employment Tax Breakdown, W-2 vs. 1099 Flowchart, Quarterly Tax Timeline). Comprehensive Answer Key: Detailed, step-by-step answers for all 10 worksheets, including calculation breakdowns for easy grading. Full Teacher Implementation Guide: A complete 4-day pacing guide, discussion prompts, student engagement strategies, and extension activities to bring the lessons to life. Empower your students to become financially savvy business owners. This isn't just a lesson on taxes; it's a lesson on survival and success in the modern workforce. Download today and equip your students for their financial future! Keywords: Financial Literacy, Gig Economy, Taxes, 1099, Self Employment Tax, Independent Contractor, Personal Finance, CTE, Economics, High School Math, Business, Entrepreneurship, Worksheets, Lesson Plan, No Prep, Project Based Learning, Real World Math. Why Parents/Schools Love It: Prepares Students for the Modern Workforce: This curriculum directly addresses the rise of freelance and gig work, providing essential, real-world skills that traditional textbooks often miss. Prevents Costly Future Mistakes: By teaching students how to manage their tax obligations now , it protects them from the shock of a huge, unexpected tax bill, penalties, and financial distress down the road. Completely Turnkey & No-Prep: It's a comprehensive, ready-to-teach unit. The detailed textbook, worksheets, visuals, and answer keys save teachers hours of research and preparation time. Fosters a CEO Mindset: The resource shifts students from a passive "employee" mentality to an active "business owner" mindset, promoting responsibility, discipline, and advanced financial planning. Builds Critical Thinking, Not Just Memorization: Through case studies, scenario analysis, and critical thinking prompts, students learn to apply complex rules to real-life situations. Target Audience (Student Classes) : Based on the content's complexity, language, and explicit examples (11th and 12th graders), target: High School (Grades 10-12) Early College (Freshman/Sophomore Level) This resource is a perfect fit for the following courses: Personal Finance Economics Business & Entrepreneurship Career & Technical Education (CTE) Life Skills / Career Readiness Applied Mathematics / Real-World Math Copyright/Terms of Use: This Book was copyrighted by Syed Hammad Rizvi. This resource is for personal and single classroom use only. You may not alter, redistribute, or sell any part of this resource. In other words, you may not put it on the Internet where it could be publicly found and downloaded. If you want to share this resource with colleagues, please purchase additional licenses from Teachsimple. Thank you for respecting these terms of use. This product is happily brought to you by Syed Hammad Rizvi
Author Creative Book Store
Rating
Tags GigEconomy, 1099, 1099NEC, SelfEmploymentTax, IndependentContractor, FreelanceTaxes, TaxLiteracy, TaxTipsForStudents, SideHustleTaxes, StudentEntrepreneur

First Apartment Rental Economics
Resources for Teachers, Classroom Management, Community Building, Math, Money, Statistics, STEM, Special Resources, Social Emotional Learning (SEL), Life Skills, Homeschool Curriculum, Homeschool Templates, Grade 9, 10, 11, 12, Worksheets & Printables, Workbooks, Worksheets, Word Searches, Teacher Tools, Lesson Plans, Quizzes and Tests, Quizzes, Tests, Assessments
If you're looking for an effective and exciting program to teach financial concepts, then look no further. With this lesson on the Economics of First Apartment Rentals, your high school students can be prepared for one of the biggest financial choices of their lives. Gone are the days of basic budgeting. This program provides a thorough academic understanding of everything that goes into renting an apartment. Students will be able to analyze lease agreements and determine hidden costs, as well as calculate the actual finances they will need in order to live on their own. The first part consists of a total of 10 pages with 4 chapters explaining some key terms related to finances. The chapter titles include: Chapter 1 - Move-In Expenses and Security Fees: The principle of funds that are unrecoverable compared to budget that is recoverable. Chapter 2 - The Iceberg Phenomenon of Rental Charges: The breakdown of administrative charges, garbage fees, and pet fees. Chapter 3 - Utility Costs in the Rental Business: The understanding of monopoly service providers and the concept of refundable deposits. Chapter 4 - Renters Insurance Economics: The formulas used for risk distribution, deductible amounts, and liabilities. This part contains interesting practical examples of how theories work. The second part is called Student Workbook and consists of 21 pages. It has 10 very extensive worksheets containing more than 80 questions aimed at checking the knowledge of some math. Some of the topics here are: Move-In Expenses and Availability of Capital The Two-Fold Nature of Security Deposits Hidden Administrative Costs Exposed Utility Connections and Credit Provisions Renters Insurance Payments and Deductibles The Science of Prorated Rent The "Pet Penalty" Price Expenses and Chances Cost Lease Contract Analysis and Punishments A Master Sheet with a final exam consisting of all the practical and useful data. PART 3: Visuals and Teacher Materials (22 Pages) Three Instructional Graphics: Three effective images suitable for classroom instruction or presentations ("The Move-In Iceberg," "The Lifecycle of the Security Deposit," "The Utility Activation Matrix"). A Detailed, Comprehensive Teacher Answer Key: Not only the answers but detailed calculations and interpretations for each question—delivering significant time savings on preparation. Teach your students to become knowledgeable and confident individuals who transition from passive consumers to informed decision-makers. Reasons why Parents/Schools appreciate it: Boosts Self-Assurance in the Real-World: With its practical approach, it is able to go beyond theoretical teaching and equips students with all the necessary skills to be able to conquer a challenging process and avoid beginner mistakes. Interdisciplinary & Challenging: The unit integrates mathematics (calculations, percentages), economics (market concepts), and language studies (dissecting a legal text) thus making learning very valuable. Fosters Financial Literacy: The program encourages students to go beyond the advertised price of a product and to examine the terms of the contract, thus becoming better consumers. Fully Comprehensive & Simplifies Teaching: This instructional resource provides teachers with all the necessary materials including detailed lesson plans, 10 worksheets for students, and a complete answer key. Classes for Students: According to the terminology used (asymmetric information, microeconomics, liquidity, sunk cost), degree of difficulty, and the topics covered, the material is most suitable for: High School Juniors and Seniors (11th and 12th Grade): These students are most receptive to achieving independence and will find the material directly relevant and useful in their near future. They may include: Personal Finance classes Economics classes (as an applied microeconomics project) Consumer Mathematics or other applied math classes Life Skills or Home Economics classes College Freshmen: The material is particularly well suited for a "First Year Experience" or "College Success" seminar. Young Adults in Community Education Programs: The material may be adjusted and presented in form of a workshop addressing the needs of young adults aged 18-25. Copyright and Usage Policy: This book is copyrighted to Syed Hammad Rizvi and is intended for personal use and classroom use only. No part of this resource can be changed, given away, or sold. Thus, it cannot be uploaded online for public access. If you want to share this resource with your friends, please buy more licenses from Teachsimple. This product is proudly given to you by Syed Hammad Rizvi.
Author Creative Book Store
Rating
Tags FinancialLiteracy, PersonalFinance, LifeSkills, Budgeting, Economics, MoneyManagement, FinancialEducation, InvestingForBeginners, RealWorldMath, ConsumerMath

Data Science Fundamentals for Kids - Statistics book
Statistics, Math, Time, Money, Measurements, Fractions, STEM, Homeschool Curriculum, Grade 4, 5, 9, 10, 11, 12, Projects, Activities, Lesson Plans, Teacher Tools, Outlines, Quizzes and Tests, Tests, Worksheets & Printables, Workbooks, Word Problems
Unleash the fascinating world of data science and statistics for children with "Data Science Fundamentals for Kids - Statistics" by Syed Hammad Rizvi. Featuring a detailed 370-page course manual tailored specifically for students from grades 5-12, this invaluable resource simplifies complicated concepts into a series of fun and easy-to-master tutorials. Starting with introductory elements of data types and sources and progressing all the way from advanced concepts of probability studies to visual representation techniques of pictographs, bar graphs, line graphs, pie charts, histograms, and box plots, measures of central tendency of mean, median, and mode statistics, dispersion of range, quartiles, and interquartile range, sampling techniques with simple and stratified sampling methods, concepts of correlation and causality, responsible uses of statistics and ethics in statistics studies, and applied examples of AI and big data statistics analysis, this statistics guide for kids helps instill crucial STEM knowledge for their. Perfect for homeschooling students, this statistics guide for kids also makes for a stellar choice for teachers and scholars seeking resources for statistics learning for children, guidebooks for beginner-level analysis of statistics and frequency analysis for students, books for kids related to STEM information, and resources for probability tutorials for middle school Why Parents/Schools Love It: Engaging and Age-Appropriate Content: Makes use of interesting stories and engaging examples to ease kids into otherwise frightening subject matter involving statistics, thereby giving kids a confidence boost in STEM fields. Comprehensive Skill Building: Encompasses all aspects of analysis from data acquisition to ethical analysis. Aiding students for future AI/data science employment purposes as well as for test preparation. Hands-On Tools/Projects: Includes guides with specific steps for creating illustrations for graphs, calculations for measures of variation, and completion of mini-projects. Encourages Critical Thinking: Teaching the importance of being unbiased, the difference between correlation and causation, and responsible data use helps prepare individuals for the data-intensive world that is the future of business and society. Flexible for Any Learning Style: Can be used for individual study, teaching groups, or supplementing a curriculum, with examples that show statistical principles in sports, games, and real life. Target Grades : Based on the complete analysis of the content, structure, and progression of the book-from very foundational concepts such as "What is Data?" and some simple tally marks in early chapters to more advanced ones like interquartile range, probability laws, sampling bias, correlation scatter plots, and ethical AI implications in later chapters-I believe the book addresses students from grades 5 through 12 most appropriately. The material progresses from simple, kid-friendly explanations using real-life analogies-such as recipes for data organization-to more sophisticated ideas, such as data skewness and mini data projects. As such, it is well-suited for middle schoolers, grades 5-8, who need to study visualization and averages, while high schoolers, grades 9-12, will appreciate the subjects of inference, causation, and what the future of technology holds based on these subjects. It is neither too simplistic for older children nor too advanced for younger ones, and the logic of progression allows for progressive learning. Copyright/Terms of Use This Book is copyrighted to Syed Hammad Rizvi. This resource is intended for home/personal use only. There shall be no changes, modifications, redistributions, or sales of this resource. In other words, it shall not be placed on the Internet where it might be accessible for downloading. “If you’d like to share this resource with fellow teachers, you are able to do so through purchasing additional licenses from Teachsimple.” Este producto llega felices a ofreceros por Syed Hammad Rizvi
Author Creative Book Store
Rating
Tags StatisticsForKids, DataScienceForChildren, STEMEducation, KidsStatisticsBook, DataFundamentals, ProbabilityForKids, DataVisualizationForBeginners, MeanMedianMode, EducationalBooksForKids, Grades5to12
Probability UNIT TEST
Math, Statistics, Grade 7, Tests, Quizzes and Tests, Teacher Tools
This resource was developed to meet the requirements of the 7th Grade Statistics & Probability Standards below: CCSS.MATH.CONTENT.7.SP.C.5 Understand that the probability of a chance event is a number between 0 and 1 that expresses the likelihood of the event occurring. Larger numbers indicate greater likelihood. A probability near 0 indicates an unlikely event, a probability around 1/2 indicates an event that is neither unlikely nor likely, and a probability near 1 indicates a likely event. CCSS.MATH.CONTENT.7.SP.C.6 Approximate the probability of a chance event by collecting data on the chance process that produces it and observing its long-run relative frequency, and predict the approximate relative frequency given the probability.For example, when rolling a number cube 600 times, predict that a 3 or 6 would be rolled roughly 200 times, but probably not exactly 200 times. CCSS.MATH.CONTENT.7.SP.C.7 Develop a probability model and use it to find probabilities of events. Compare probabilities from a model to observed frequencies; if the agreement is not good, explain possible sources of the discrepancy. CCSS.MATH.CONTENT.7.SP.C.7.A Develop a uniform probability model by assigning equal probability to all outcomes, and use the model to determine probabilities of events.For example, if a student is selected at random from a class, find the probability that Jane will be selected and the probability that a girl will be selected. CCSS.MATH.CONTENT.7.SP.C.7.B Develop a probability model (which may not be uniform) by observing frequencies in data generated from a chance process.For example, find the approximate probability that a spinning penny will land heads up or that a tossed paper cup will land open-end down. Do the outcomes for the spinning penny appear to be equally likely based on the observed frequencies? CCSS.MATH.CONTENT.7.SP.C.8 Find probabilities of compound events using organized lists, tables, tree diagrams , and simulation. CCSS.MATH.CONTENT.7.SP.C.8.A Understand that, just as with simple events, the probability of a compound event is the fraction of outcomes in the sample space for which the compound event occurs. CCSS.MATH.CONTENT.7.SP.C.8.B Represent sample spaces for compound events using methods such as organized lists, tables and tree diagrams . For an event described in everyday language (e.g., "rolling double sixes"), identify the outcomes in the sample space which compose the event. CCSS.MATH.CONTENT.7.SP.C.8.C Design and use a simulation to generate frequencies for compound events.For example, use random digits as a simulation tool to approximate the answer to the question: If 40% of donors have type A blood, what is the probability that it will take at least 4 donors to find one with type A blood? LICENSING TERMS: This purchase includes a license for one teacher only for personal use in their classroom. Licenses are non-transferable, meaning they can not be passed from one teacher to another. No part of this resource is to be shared with colleagues or used by an entire grade level, school, or district without purchasing the proper number of licenses. COPYRIGHT TERMS: This resource may not be uploaded to the internet in any form, including classroom/personal websites or network drives, unless the site is password protected and can only be accessed by students.
Author The Math Cafe
Tags Probability, Unit Test, Google Forms, Probability And Statistics Unit Test Part 1

Scatter Plots & Two-Way Tables UNIT TEST
Math, Statistics, Grade 8, Tests, Quizzes and Tests, Teacher Tools
This resource was developed to meet the requirements of the 8th Grade Statistics & Probability Standards below: CCSS.MATH.CONTENT.8.SP.A.1 Construct and interpret scatter plots for bivariate measurement data to investigate patterns of association between two quantities. Describe patterns such as clustering, outliers, positive or negative association, linear association, and nonlinear association. CCSS.MATH.CONTENT.8.SP.A.2 Know that straight lines are widely used to model relationships between two quantitative variables. For scatter plots that suggest a linear association, informally fit a straight line, and informally assess the model fit by judging the closeness of the data points to the line. CCSS.MATH.CONTENT.8.SP.A.3 Use the equation of a linear model to solve problems in the context of bivariate measurement data, interpreting the slope and intercept.For example, in a linear model for a biology experiment, interpret a slope of 1.5 cm/hr as meaning that an additional hour of sunlight each day is associated with an additional 1.5 cm in mature plant height. CCSS.MATH.CONTENT.8.SP.A.4 Understand that patterns of association can also be seen in bivariate categorical data by displaying frequencies and relative frequencies in a two-way table. Construct and interpret a two-way table summarizing data on two categorical variables collected from the same subjects. Use relative frequencies calculated for rows or columns to describe possible association between the two variables.For example, collect data from students in your class on whether or not they have a curfew on school nights and whether or not they have assigned chores at home. Is there evidence that those who have a curfew also tend to have chores?
Author The Math Cafe
Tags Scatter Plots, Two Way Tables, Unit Test, Google Forms, Two Way Scatter Plot, Scatter Plots Worksheets 8th Grade
7th Grade Statistics UNIT TEST
Math, Statistics, Grade 7, Tests, Quizzes and Tests, Teacher Tools
About the 7th Grade Statistics UNIT TEST The 7th Grade Statistics UNIT TEST is a comprehensive tool designed to assess students’ comprehension of 7th grade statistics and probability concepts. It focuses specifically on the use of random sampling for population inferences. This assessment package, equipped with a dual format, comes in both hard copy and Google Forms versions - perfectly suited for traditional classroom settings as well as online or blended learning environments. Question Format and Distribution A variety of question formats such as vocabulary exercises, multiple-choice queries, and constructed response provisions. Inclusive of twenty questions divided into six vocabulary exercises. The distribution comprises: twelve multiple-choice queries, and two constructed responses. Eco-friendly Provisions & Quick Assessment Tools: To aid environmental-friendly practices within classrooms or homeschool environment , separate student answer sheets have been provided which works economical on printing costs. Conveniently included are answer keys with an optional scoring guide for quick assessment from educators' perspective. Effective Usage Strategies: This carefully crafted unit test can be used effectively not only in whole group settings but also serve well within breakout groups or assigned as standalone homework reinforcing key statistical principles assimilation. Proliferation & Value Proposition: With its strong accordance to 7th grade statistics & probability standards, it stands out particularly towards promoting better retention about drawing comparative differences between varied populations; estimating variability between centers by expressing multiple measured variability factors thereby inseminating useful insights. Note:- The product usage involves specific licensing terms mitigating unauthorized sharing across digital platforms without adequate licenses hence ensuring respected Intellectual property rights are diligently respected. Exclusive Access: As part of stringent safety measures, the test is password-protected thereby assuring safe access limited solely to designated students on classroom/personal websites. Make your interaction with undertaking advanced statistics explorations convenient with this thoughtfully crafted resource. The Finer Details: Specially tailored for 7th grade math curriculum making it essential for efficient teaching-learning processes. Focused on the sub-discipline of statistics – a apt addition to your teaching toolkit!
Author The Math Cafe
Tags Statistics, Probability, Assessment, Sampling, Inferences
Compound Probability TASK: Guess the Test!
Math, Statistics, Grade 7, Tests, Quizzes and Tests, Teacher Tools
Compound Probability TASK: Guess the Test! This quality teaching resource targets 7th-grade Mathematics educators with specific emphasis on Statistics. The primary focus is on compound probability tasks, predominantly regarding independent events. Students are offered both entertaining and educational challenges in the guise of a multiple-choice test. Main Features Promotes diligent problem-solving: Students tackle complex compound probability issues, with calculator use strongly advised. Versatile task format: Presents three key tasks based around individual compound likelihood scenarios. Here, students learn to multiply probabilities. In-depth academic engagement: Includes challenge questions and an exploratory challenge segment to foster a deeper understanding and pull learners in. A plethora of applications: Perfect for independent study or group activities, supplemented by optional Guess the Test! quizzes to mix things up. Add-on Features: Guess the Test Dot Plots & Answer Key The 'Guess the Test Dot Plots' allows for interactive classroom discussions post-quizzes. It works by displaying number lines meant for dot plots which helps in assessing student's performance as they mark their scores corresponding to each plot followed by group discussion comparing various quiz results . An answer key is included along side these features making this product even more valuable lending precise guidelines forming correct solutions. Educational Standards Compliance & Licensing Terms This product strictly adheres to 7th Grade Statistics & Probability Standards ( CCSS.MATH.CONTENT.7.SP.C.8 ). It effectively introduces concepts through well-structured lists,tables,and simulations; comprehensive understanding of what they represent; representing sample spaces and identifying outcomes constituenting predefined event circumstances presented in a friendly language. Purchases of this resource grant usage terms that are favorable toward personal classroom use by one teacher only, indicating licenses cannot be transferred from one teacher to another providing secure and nonviolent access to this resource.
Author The Math Cafe
Tags Compound Probability, Independent Events, Multiple-choice Quiz, Calculator Use, Statistics