12 FREE DIVISION CHARTS | Tables 1 to 12


- Grades
- Grades 3–6
- Pages
- 8
- File type
- Preparation
- Print ready


- Subject
- Math
- Topic
- Division facts, Division tables
- Resource types
- Worksheets
- Preparation
- Print ready
- Standards
- 3.OA.C.7
Product description
From the author
12 Division tables to complete
- Practicing tables from 1 to 12
- Animal theme
Come up now to download this fantastic resource for free that will help your students practice the division from 1 to 12.
B. general product information:
Through the following points, I am going to share valuable information about this resource so that you can learn about it and its content and decide to download it now.
1. Brief introduction:
As is known, division is perhaps one of the most complicated operations for children, which is why it is important that we look for teaching resources that make learning division not considered so difficult for children.
2. Product Description:
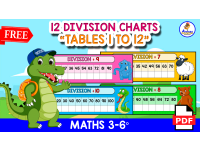
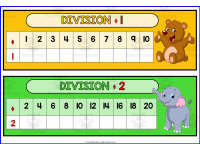
This product is made up of 12 charts of the division tables from 1 to 12.
3. Benefits of using this product:
This product has multiple benefits because:
- It will help children practice the 12 division tables from 1 to 12.
- It will motivate children to learn the division tables from 1 to 12.
4. Number of pages contained in this document:
The eight-page PDF includes six chart pages with two tables per page.
5. Topic addressed in this document:
The division from 1 to 12.
C. secondary points regarding the product:
6. Children's ages in which it can be applied:
In children from 8 to 12 years old who are learning division.
7. Version in which this resource is found:
Available in A4, PDF.
8. How it should be printed:
Print it as it is, in A4 format.
This file is for personal use only. It is not allowed to be resold or shared with others.
Related resources
More resources teachers may find useful
24 related resources were found using this product's title, contributor, categories and tags.

In the classroom
Teaching tips & learning objectives

Learning objectives
Use the chart as a reference to recall multiplication and division fact families for numbers 1 through 12.

Teaching tips
Post as a classroom reference chart or hand out for desk reference during multiplication/division fact practice.
Model reading a row in reverse (e.g., finding 60 in the 6-row) to show students how the same chart supports division fact recall.

Skills covered
Multiplication/division fact reference — students locate a number within a row to recall its multiplication and, by reversal, division facts for factors 1-12.

No reviews yet
Downloaded this resource? Tell other teachers how it went.
Curriculum
Standards, concepts & topics
Standards
 Standards
- 3.OA.C.7
Core concepts
 Core concepts
Multiplication tables
Division fact families
 Topics
More to explore
You may also like