Comparing Overlapping Data QUIZ


About This Product
Comparing Overlapping Data QUIZ: An Analytical Tool for 7th Grade Statistics & Probability
The Comparing Overlapping Data QUIZ provides a robust way for learners to valuably assess their understanding of analyzing numerical data—key component of 7th grade math. Comprehensively tailored to align with statistics and probability standards, it fosters students' ability to draw informal comparative inferences about two populations by visually assessing the overlap and measuring the distance between centers.
Coverage of Key Subject Areas
- CCSS.MATH.CONTENT.7.SP.B.3: The assignment tasks learners with measuring variation in data distribution — e.g., comparing heights among players on different sports team.
- CCSS.MATH.CONTENT.7.SP.B.4: Here, students apply center measures and variability measures from random samples comparative inferences about two populations—an essential skill when comparing real world scenarios such as word lengths between textbooks from different grades.
A Versatile Format For All Teaching Contexts
This quiz includes a selective set of 10 multiple-choice questions that are deliverable either digitally through Google Forms or via a printed PDF file included within the downloadable package.
Note:This tool doesn't simply test visual recognition—it pushes learners further into analytical thinking by requiring them to measure visual overlap using terms like variance magnitude; gearing them well for advanced studies.
Possible Application Strategies:
- Tackle it collectively on smart-boards during whole-groups lessons.
- Distribute paper copies amongst smaller groups or pairs.
- Incorporate as individual digital copies - even as homework assignments.
The Comparing Overlapping Data QUIZ emphasizes understanding over mere memorization, making it a perfect tool for both teachers and learners to fulfill their academic requirements in 7th grade statistics & probability concepts.
What's Included
This resource contains a 10 question, multiple choice quiz in two formats:
1) Printable PDF
2) Option for Google Forms (link provided on first page of PDF download)
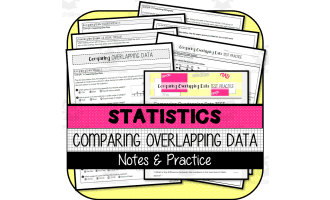
Please Note: This quiz requires students to not only just visually the similarity between data, but to also calculate the degree of visual overlap by "measuring the difference between the centers by expressing it as a multiple of a measure of variability." (See the standard requirements of SP.B.3 below). If your students are NOT familiar with this skill but you would like them to be, check out this instructional resource from The Math Cafe:
Comparing Overlapping Data NOTES & PRACTICE
0 Reviews
Check out these other great products