Double Bar Graph Worksheets – 2 Levels for Grades 3–5



- Grades
- Grades 3–5
- Pages
- 4
- File type
- Answer key
- Included


- Subject
- Math, Graphing
- Topic
- Double bar graphs, Data interpretation
- Resource types
- Worksheets, Assessments
- Answer key
- Included
- Standards
- 3. MD.B.3
Product description
From the author
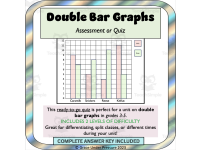
This ready-to-go quiz is perfect for a unit on double bar graphs in grades 3-5.
The first page uses a double bar graph with one-to-one correspondence. Students compare how many boys and girls like specific kinds of chocolate bars.
The second page uses a double bar graph with many-to-one correspondence (one square represents four people). Students compare how many kids in each grade have names of different lengths. Students have to determine that half a square represents two people since a whole square represents 4 people.
These two levels are great for differentiating, split classes, or different times during your unit!
Grades to Use With:
This math assessment is designed for students in grades 3-5 who are learning about graphing, data, and statistics. In the USA, this is in Common Core Standards in the third grade and in British Columbia, Canada, it is addressed in Grade 5. It could also be used in middle school special education classrooms.
What's Included:
4 Page PDF:
Title Page
One-Page Double Bar Graph Quiz with one-to-one correspondence
One-Page Double Bar Graph Quiz with many-to-one correspondence
Complete Answer Key
Related resources
More resources teachers may find useful
24 related resources were found using this product's title, contributor, categories and tags.


In the classroom
Teaching tips & learning objectives

Learning objectives
Read double bar graphs and compare quantities using the given scale.

Teaching tips
Check that students understand each graph’s key and scale before answering.

Skills covered
Graph interpretation, comparison and scaled counting.
Good to know
Questions teachers ask about this resource
How do the two levels differ?
The first graph uses one person per square. The second uses four people per square, so students must interpret both whole and half-square values.

No reviews yet
Downloaded this resource? Tell other teachers how it went.
Curriculum
Standards, concepts & topics
Standards
 Standards
- 3. MD.B.3 — Draw a scaled picture graph and a scaled bar graph to represent a data set with several categories. Solve one- and two-step “how many more” and “how many less” problems using information presented in scaled bar graphs. For example, draw a bar graph in which each square in the bar graph might represent 5 pets.
Core concepts
 Core concepts
Double bar graphs; keys; scale.
 Topics
Explore more
Categories this resource belongs to
Explore related searches
More to explore
You may also like