


3,998 products added recently
Graphing Worksheets
Enhance your math curriculum with graphing worksheets that help students interpret and create various types of graphs. These activities support data literacy and critical thinking. Use them to improve students' ability to analyze and present information visually.

5th Grade Summer Review or Practice Math Workbook
Math, Fractions, Graphing, Multiplication and Division, Order Of Operations, Addition and Subtraction, Algebra, Grade 4, 5, 6, Worksheets & Printables, Workbooks, Word Problems, Worksheets
Keep your students engaged and confident in math all summer long with this 5th Grade Summer Math Review Packet ! Designed to prevent the summer slide , this resource provides targeted practice on 20 essential 5th grade Common Core math skills —all identified as challenging concepts that lay the foundation for 6th-grade success . What’s Included? ✅ Teaching or note sheets for each skill ✅ Practice worksheets for reinforcement ✅ Detailed answer keys with step-by-step solutions ✅ Pre-review pages for select skills to refresh prior knowledge ✅ Teaching & tutoring tips for parents and educators Math Skills Covered: Multiply 2-digit numbers by 3-digit numbers Divide 4-digit numbers by 2-digit numbers Add, subtract, multiply, and divide whole numbers: word problems Evaluate numerical expressions with parentheses Convert decimals between standard and expanded form using fractions Compare decimal numbers (Ordering decimals included) Add and subtract decimals: word problems Multiply a decimal by a power of ten Multiply money amounts: multi-step word problems Divide by decimals Understand fractions as division: word problems Add and subtract fractions with unlike denominators: word problems Multiply two fractions Divide unit fractions and whole numbers: word problems Add, subtract, multiply, and divide mixed numbers Graph points from a table Multi-step problems with customary unit conversions Describe relationships among quadrilaterals Volume of compound figures Create and interpret line plots with fractions This packet is easily formatted to print and bind for a summer workbook or could be used individually in tutoring sessions or summer school lessons, as review worksheets. Practice could also help those that are skipping a grade in math, to ensure understanding of concepts that may be missed in the transition. Tags: 5th grade math review, summer math packet, prevent summer slide, 5th to 6th grade math transition, common core math worksheets, math tutoring resources, printable math workbook, summer school math activities, fractions and decimals practice, multiplication and division word problems
Author Kel's Klass
Tags 5th Grade Math Review, 5th Grade Summer Math Packet, Prevent Summer Slide, 5th To 6th Grade Math Transition, Common Core Math Worksheets, Math Tutoring Worksheets, Summer School Math Workbook, Adding And Subtracting Fractions, Multiplication And Division Practice
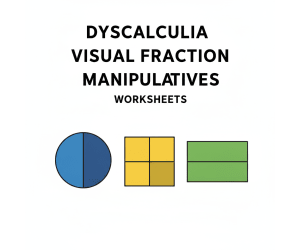
Dyscalculia Visual Fraction Manipulatives
Math, Fractions, Addition and Subtraction, Addition, Subtraction, Graphing, Money, Number Lines, Order Of Operations, Time, Homeschool Curriculum, Homeschool Templates, Grade 3, 4, 5, 6, 7, Worksheets & Printables, Workbooks, Worksheets, Word Searches, Teacher Tools, Assessments, Lesson Plans, Quizzes and Tests, Quizzes, Tests
Change the nature of instruction for fractions, and help all students by using this complete, evidence-based guide for teaching fractions to students who may have any or all of the following: Dyscalculia, Learning Disabilities in Mathematics, or Anxiety with regard to mathematics. Are you an educator or parent looking for an effective way to teach your students with prior difficulties with abstract mathematic concepts? If so, this is the resource for which you have been searching. This is NOT just another worksheet packet. This is a complete neuro-informed intervention system built to circumvent all cognitive barriers common to the students you teach, and create true and lasting understanding of fractions that will be retained for the remainder of the student's educational career. By following the Concrete-Pictorial-Abstract (CPA) framework along with the principles of cognitive science, this guide provides students with a means for teaching fractions in a way that they will finally be able to process and master from their neurodivergent brain perspective. Your students will no longer suffer from mathematics anxiety or the "Whole Number Bias", which results in students believing that 1/8 is greater than 1/3. We use Linear Fraction Bars as a visual aid and High Contrast Visual Mapping to make fractions tangible and explainable to students through the use of their neural systems, thus enabling students to understand fractions as Predictable and Intuitive. We deliberately avoid all of the Circular Fraction Models (i.e., Pizza) that confuse students with poor or absent spatial perception. THIS 37-PAGE COMPREHENSIVE GUIDELINE CONSISTS OF: The Educators Guide: This document consists of an in-depth look at the "why" behind the method in phase one. It will include definitions of the cognitive make-up behind dyscalculia, the incorrectness of standard methods, and the architectural guidelines for creating educational tools, including manipulatives that are compatible with how the brain works. This phase will also include case studies based on individual students that can be utilized in grade-level math classes. The Student Workbook: Phase Two will consist of a sequential ten part set of worksheets that will serve as step-by-step guides for students in grades three through five. In other words, the first page of the ten page guide will help students learn what a numerator and a denominator are before they then will be a part of the worksheet on determining whether two fractions are equal or comparable. The remainder of the pages will continue to follow the same sequence, with the last page covering mixed numbers. The Teacher Resources and Visual Aids Section: This section contains all the resources necessary for teacher's to correctly implement the above two guides. In addition to possessing high-resolution diagnostic diagrams that can be utilized in the classroom, this section also contains an answer key that has been developed with pedagogical notes included, and a clinical implementation guide that contains scripted interventions for how to address common errors made by students. PLEASE NOTE THE FOLLOWING Group: Individuals who provide direct instructional support to students with disabilities and other struggles in mathematics, such as: SE Teachers/Specialists Math Interventionists/ Specialists (Tier 2 & 3) Resource Room/Co-Teach Models Tutor and Educational Therapists Homeschool Parents General Ed Teachers who want to use effective differentiation strategies. Break the cycle of poor math performance. Get your students the tools they need to develop confidence and obtain true mastery of fractions through this master guide through the Math Anxiety. Key Terms: Dyscalculia, Math Intervention, Special Education Math, Fractions, Visual Math, Manipulatives, Math Anxiety, Learning Disabilities, Third, Fourth, Fifth, Grade, Homeschooling, RTI, Math Support, Number Sense, *CPA Framework (Concrete, Picture, Abstract) Teacher’s Guide. Reasons Why Parents/Schools Are Enthusiastic About This Resource: Evidence Based and Neuro-informed: This is truly not just a collection of activities but rather a structured program based on cognitive science; designed specifically to help students whom have dyscalculia. Eliminates Math Anxiety: The clear, visual, step-by-step approach removes uncertainty and abstract confusion which builds student confidence and creates a positive attitude ("I can do math") about math. Comprehensive All-In-One System: The complete package allows educators to save a tremendous amount of time in planning. It contains the theoretical document, the workbook (student-facing) as well as the full answer key that contains additional clinical cues. This resource is ready for immediate use as an intervention resource. Promotes True Understanding, Not Just Rote Memorization: By making fractions physical and visual, this program goes beyond mere memorization of rules and fosters true, deep conceptual understanding, which can be applied to future concepts. Highly Targeted for Intervention: This resource is an excellent Tier 2/3 resource for intervention, special education resource rooms, tutoring, and homeschooling. It provides very powerful and focused support, right where struggling learners require it most. An in-depth analysis of the content, research, and worksheets indicates the primary target audiences are: Special Education Teachers: This is a critical instructional support for teachers within this specialty since the resource was designed specifically for students diagnosed with learning disabilities. Math Interventionists: This resource meets the needs of small groups of students (Tier 2 and Tier 3) who are considerably below grade level in mathematics. Educational Therapists and Tutors: Qualified professionals who provide one-on-one support to students with dyscalculia. Homeschooling Parents: Especially for those children who have a diagnosis or possibly math deficits. Targeted Grade Levels: The component will specifically target grades three, four and five because all of the fractions address fundamental fractions through to adding fractions and mixed numbers, which are all taught at these grade levels. Rewriting Terms: All rights reserved. The author has copyright (Copyrighted by Syed Hammad Rizvi) on this work. A teacher may use this resource for his/her classroom and for private individual use. You may not modify this resource, distribute it, or sell it. You may not publish or make it available on the internet. If you would like to share this resource with your colleagues, please buy additional licenses from Teachsimple. Thank you for being honest and following my copyright terms. This product is made with love by Syed Hammad Rizvi.
Author Creative Book Store
Rating
Tags Dyscalculia, Dyscalculiaresources, Dyscalculiasupport, Mathintervention, Visualmath, Mathmanipulatives, Mathlearningdisability, Specialneedsmath, Neurodivergentlearning, Cpaframework

Tricky Graphs- Bias and Data: Bar Graph Worksheet Line Graph Worksheet
Math, Graphing, Life Skills, Special Resources, Grade 6, 7, 8, 9, Worksheets & Printables, Worksheets, Lesson Plans, Teacher Tools
Critical Thinking and Graphing and Media Literacy all in one! This middle grades math lesson for students in grades 6-9 helps teach your class about how graphs can be displayed in tricky and misleading ways. Your students will learn how to spot these biases and re-create the graphs in a more fair manner. This is real-life learning that will serve your students long past your graphing unit. It's a crucial life skill that is often not taught in school. Here’s a real-life math lesson that will be a great addition to your middle school graphing unit! Students are shown three unique and realistic graphs Each one presents information in a biased or misleading way. With step-by-step instructions, your students will be guided through the basics: 1) Carefully reading and interpreting each graph: the axes, the scales, the data that is included 2) Noticing any biases or manipulations that may be present 3) Determining what the author probably wanted to guide them to think when reading the initial graph On the second page for each situation, students are given extra information and tasked with re-creating the graph more fairly. Blank graphs (with scales and labels) are given to students; they will use the information provided in each table to create a new graph that displays the data in an accurate way. Reflection prompt questions are also included to stimulate discussion and students explaining their ideas in words. The misleading and biased scenarios include: Choosing a truncated vertical scale to overemphasize change Not plotting enough data points for the full picture Graphing an absolute amount when a rate would be more informative The three graphs include one bar graph and two line graphs. What's Included: 8 Page PDF Ready to Print and Use! Teacher Instructions 6 Worksheets: Two Pages each for Three Scenarios (including 15 questions and 3 graphs for students to create) Complete Answer Key
Author Grace Under Pressure
Tags Bar Graph Worksheet, Line Graph Worksheet, Bias, Data Collection, Data Presentation, Graphing, Graphing Worksheet, Critical Thinking, Life Skills, Media Literacy
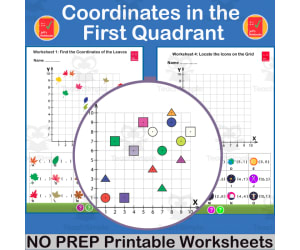
Coordinates in the 1st Quadrant – Plotting Practice
Math, Geometry, Graphing, Grade 5, Worksheets & Printables, Worksheets
This resource will enable your students practice plotting and reading coordinates in the first quadrant of a Cartesian plane where all the numbers are positive with a range of different graphic images leading up to points located on an x-y graph simply with letters. For each set of graphics (leaves, astronaut icons, geometric shapes, and letters)there are two separate activities: Finding the coordinates of points on an x-y Grid in the 1st Quadrant Given set of coordinates, locate their position on an x-y Grid in 1st Quadrant In addition, for a final set of worksheets, again there are the two activities, but this time the coordinates or points drawn on the axis form geometric shapes. This provides a good starting point for further questioning or investigation that could include: - naming the shapes - drawing lines of symmetry and labeling coordinates on the line - finding the coordinate of the centre of each shape - apply transformations and note the new coordinates .......... How many Worksheets in total ? Unlimited, because at the click of a button all the numbers or the location of the objects on the grid are randomized providing you with a new set of questions for classwork, homework, revision, assessments etc. Also as these worksheets require no preparation they are ideal worksheets to leave for a substitute teacher if needed. You will also have 2 sets of blank worksheets so that your students can create their own worksheets, or use them for the investigations suggested above Answers can be found on the second page of every worksheet, automatically generated when you create a new worksheet. Note These resources are PDF documents and work with the official Adobe Acrobat Reader on Windows or Mac computers with the randomising buttons also working via a touchscreen (PC or Mac)or on an Interactive Whiteboard. Common Core Standards - 5th Grade CCSS5.G.A.1 Use a pair of perpendicular number lines, called axes, to define a coordinate system, with the intersection of the lines (the origin) arranged to coincide with the 0 on each line and a given point in the plane located by using an ordered pair of numbers, called its coordinates. Understand that the first number indicates how far to travel from the origin in the direction of one axis, and the second number indicates how far to travel in the direction of the second axis, with the convention that the names of the two axes and the coordinates correspond (e.g., 𝘹-axis and 𝘹-coordinate, 𝘺-axis and 𝘺-coordinate). UK National Curriculum - Year 4 Programme of Study - Geometry - position and direction Describe positions on a 2-D grid as coordinates in the first quadrant. Here is a link to the next level on coordinates: Cartesian Coordinates in the Four Quadrants. Plotting and Locating points
Author Jeff's Notebooks
Rating
Tags Math, Coordinates, Plotting Points, Cartesian Coordinates, First Quadrant, 1st Quadrant, Positive Axes, Graphing Coordinates, Jeff's Notebooks, Interactive Whiteboard

Math Vocabulary Crossword Puzzles
Math, Addition and Subtraction, Addition, Order Of Operations, Subtraction, Multiplication and Division, Division, Geometry, Graphing, Multiplication, Grade 6, 7, 8, Crosswords Puzzles, Worksheets, Worksheets & Printables
Introducing an incredible addition to the realm of 6th-grade math education: a collection of 50 meticulously crafted crossword puzzles, designed to teach and reinforce vital mathematical vocabulary. This exceptional resource serves a multitude of purposes, making it an invaluable asset for teachers, students, and parents alike. For teachers, these puzzles are a godsend for those unforeseen circumstances when substitute plans are required. Simply hand out these crosswords, and students will stay actively engaged in meaningful math practice, even in your absence. Furthermore, in this age of remote learning, these puzzles seamlessly integrate into distance learning platforms, allowing students to continue their math education from the comfort of their own homes. The versatility of these puzzles extends to homework assignments as well, enabling students to independently reinforce their math vocabulary skills beyond the confines of the classroom. Lastly, for those quick learners who finish their work ahead of their peers, these puzzles provide an enriching and stimulating activity to further their mathematical understanding. To streamline the evaluation process, answer keys are thoughtfully included, allowing for effortless assessment of student progress. With the answer keys readily available, teachers can efficiently gauge their students' performance and identify areas that require additional focus or intervention. This valuable tool not only saves time but also enhances the effectiveness of the learning experience. Beyond the practical benefits, these captivating puzzles foster critical thinking and problem-solving skills. Each crossword serves as a mini-adventure, enticing students to dive into a world of mathematical discovery. As they unravel the interconnected web of clues and fill in the correct answers, students will sharpen their analytical abilities and hone their problem-solving techniques. These puzzles transform math vocabulary learning from a tedious chore to an enjoyable and intellectually stimulating pursuit. In conclusion, this remarkable collection of 50 captivating crossword puzzles revolutionizes the way 6th-grade students learn and review math vocabulary. With their versatility and effectiveness, these puzzles cater to various educational settings, from substitute plans to distance learning and homework assignments. Students will develop a profound understanding of essential mathematical terms and concepts while cultivating critical thinking and problem-solving skills. Say goodbye to dull and uninspiring math vocabulary exercises, and embrace the engaging and impactful learning experience that these puzzles provide.
Author Matemaths
Tags Matemaths, Puzzle, Crosswords, Math Vocabulary
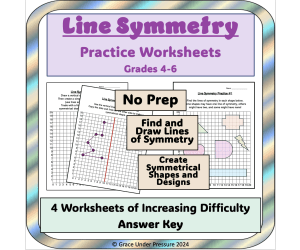
Lines of Symmetry Worksheets: Finding Symmetry in Polygons on Grids
Math, Graphing, Geometry, Grade 4, 5, 6, Worksheets & Printables, Worksheets
Line Symmetry Practice Worksheets Grades 4-6 Here are four worksheets of increasing difficulty to help your students in grades 4-6 practice the following skills: 1) Identifying and drawing lines of symmetry on polygons on a grid. 2) Creating interesting shapes and designs that are symmetrical either vertically or horizontally. How to Use: Choose which worksheets you will use with your students and print a class set. Practice 1: Students look at six shapes on a grid. They need to draw lines of symmetry on each shape (one has none, two have one line, two have two lines, and one has a diagonal line of symmetry). Practice 2: Students are shown half of a large, interesting shape on a grid. They need to recreate the other half over the given line of symmetry. Practice 3: Students are asked to draw a line of symmetry and make their own half shape. They will trade with a friend and finish their friend’s shape. Practice 4: Students are asked to create a colourful design on a grid. Parts of the design should be vertically and horizontally symmetrical. The finished products could be a beautiful bulletin board display! These worksheets could be used in many ways. They can become part of your unit as activities during class lessons. One or more could be a homework assignment. You could even use one for an assessment of your students' learning. Grades to Use With: These line symmetry worksheets are designed for students in grades 4-6 who are learning about symmetry or the reflection type of transformation. They could also be used in middle school special education classes. What's Included: 6 Page PDF: Ready to Print and Use! Teacher Instructions Draw Line of Symmetry Worksheet Finish a Symmetrical Shape Worksheet Create Half a Shape Worksheet Create a Design with Symmetrical Elements Worksheet ANSWER KEY INCLUDED © Grace Under Pressure 2025
Author Grace Under Pressure
Tags Line Symmetry, Line Symmetry Worksheet, Lines Of Symmetry, Lines Of Symmetry Worksheet, Symmetry, Symmetry Worksheet, Geometry Worksheet, Coordinate Plane, Reflections
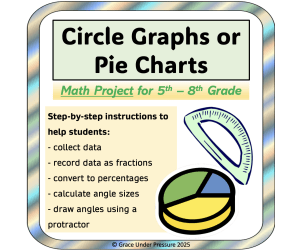
Math Project: How to Make Circle Graphs and Pie Charts
Math, Percentages, Geometry, Graphing, Statistics, Grade 5, 6, 7, 8, Worksheets & Printables, Worksheets, Lesson Plans, Teacher Tools, Projects, Activities
This fun math project includes clear step-by-step instructions to show your students how to make a circle graph. This is a great way to review several math skills while showing how useful they can be! Tasks include: - Writing a survey question: Your students learn to write a question that has exactly six possible answers. - Collecting data: Your students can ask the members of your class their question. They collect data using a tally chart. They need to ask exactly 25 people. - Recording results as a fraction: Once they have their data, they can turn each answer into a fraction with a denominator of 25. - Calculating an equivalent fraction: Then, they calculate an equivalent fraction with a denominator of 100. - Working with percent (written as a decimal): Finally, they turn that fraction into a percent in decimal form. They use this percent to multiply by 360 degrees in a circle (they can use a calculator for this part) to find out how many degrees each answer gets. - Drawing angles with a protractor: They carefully draw the six angles in their pie chart, one by one. - Labeling a graph: They label the graph to make it clear for others to read. Grades to Use WIth: This math project works well in the middle grades (4-8) when students know how to use protractors, calculate with fractions and decimals, and make graphs. It could also work well in a high school special education classroom. What's Included: A total of 5 pages. in PDF Format Title Page Survey Page Equivalent Fractions Page Decimals Page Circle Graph Template Standards: 7th Grade Geometry: Draw shapes with specific conditions. 4th Grade Fractions: Write equivalent fractions. Write fractions as equivalent decimals out of 100. 6th Grade Ratios and Proportional Relationships Work with percentages.
Author Grace Under Pressure
Rating
Tags Math Project, Pie Charts, Graphing, Data Collection, Percent, Angles, Protractor, Equivalent Fractions, Circle Graphs Math, Circle Graphs

Savings Goals: Middle School Financial Literacy, Graphing, Patterns
Finance, Life Studies, Home Economics, Math, Algebra, Graphing, Money, Life Skills, Special Resources, Grade 6, 7, 8, Worksheets & Printables, Word Problems, Worksheets
Teach your middle grades students in 6th, 7th, and 8th grade all about saving up money for large purchases and help them practice a variety of intermediate math skills: using ratio tables, graphing, completing operations with large numbers, using percentages , and more! This middle school financial literacy & budgeting lesson has six ready-to-use worksheets to teach your class how to develop savings goals and save their money for life's big-ticket items. How to Use: Print 5 or 6 worksheets for each student. Go through the information on the first page and give your students time to complete the vocabulary definitions (budget, credit card, loan, and interest). Students will then research an item of their choice (between $200 to $300). They will practice calculating the sales tax for it. On the second page, students will complete a simple ratio table and the included graph to calculate how many hours of work will be required to pay for their item. They will calculate how many weeks of work this will take based on how much they work each week. On the third and fourth pages, students will complete similar activities for even larger savings goals: a new car and a down payment for a home. Your students get a choice for how they will consolidate their learning: they can either create a cartoon or write a paragraph reflection to share what they learned about savings goals. Grades to Use With: This lesson is specifically designed for your middle grades students who are learning about ratios, graphs, tables, and financial literacy in math class. It's a great way to incorporate real-world math and budgeting into your 6th, 7th or 8th grade classroom! It could also be used in high school special education classes where appropriate. What's Included: 8-Page PDF: Ready to Print and Use! Teacher Instructions 4 Pages of Worksheets 2 Pages of Student Reflection Choices Complete Answer Key If you enjoy this financial literacy activity, check out others in my store! Grace Under Pressure
Author Grace Under Pressure
Rating
Tags Middle School Financial Literacy, Financial Literacy, Budget, Budgeting, Saving Money, Savings Goals, Patterns Tables, Graphs, Graphing, Tables Of Value
Solving Systems by Graphing Guided Notes + Homework Set
Math, Graphing, Grade 9, 10, 11, 12, Worksheets & Printables, Worksheets
Solving Systems by Graphing Guided Notes and Homework Set This 9-12th grade math resource teaches students to solve systems of equations by graphing. The informative guided notes scaffold the process of graphing two equations and finding their point of intersection. Students learn concepts such as dependent and independent variables while practicing graphing lines. After the instructional guided notes activity , a homework assignment gives students a chance to apply their new skills. Used for whole class, small group, or independent study, this resource builds graphing abilities. With answer keys included, the resource provides teaching materials to reinforce this vital Algebra skill. Students gain graphical comprehension and conceptual knowledge with these engaging Guided Notes and Homework.
Author Eddie McCarthy
Tags Solving Systems, Graphing, Algebra, Math Homework, Guided Notes

Math Practice Simplified K - Tables & Graphs
Math, Graphing, Grade 5, 6, 7, 8, Worksheets & Printables, Word Problems, Worksheets
This mathematics-based resource is designed for grades 5-8. It’s imperative for students to have a strong foundation in basic math skills. This resource provides real-world activities to help students understand how to read and interpret data. Information from tables, charts and graphs are presented in this resource. Students will then present data in tables and graphs of their own making. Additional lessons on mean, median, mode and range are provided. Tables and graphs include: scattergrams, stem and leaf plots, line plots, box plots, histograms, among others. This resource is perfect to prepare students to succeed on standardized tests. An answer key is included. Aligned to National Council of Teachers of Mathematics (NCTM) Standards.
Author Classroom Complete Press
Tags Math, Mathematics, Tables, Graphs, Statistics, Probability, Data Analysis, Elementary, Middle, Answer Key
Statistics Word Problems: Compare Two Data Sets of Annual Salaries
Math, Graphing, Measurements, Statistics, Grade 6, 7, 8, Worksheets & Printables, Worksheets, Word Problems
This middle school math lesson allows your students in grades 6-8 to apply the statistical skills they have been learning in class to a real-world financial literacy scenario: the annual salaries of workers who have a college degree compared to those who do not have one. It is a real world math activity that includes five worksheets all ready to go! Your students will: - Make two dot plots to display two data sets (that are included with the lesson): wages for people with a college degree and those without - Share observations about the distribution of data in each set - Calculate the mean, median and interquartile range for each data set - Draw inferences about whether there is an effect of a college education on someone's annual salary - Consider if the sample that was used is representative This lesson was designed to specifically address 7th Grade Common Core Math Standards for the Statistics and Probability strand: 7.SP.A.1 7.SP.B.3 7.SP.B.4 What's Included: 7 Page PDF- Ready to Print and Use! - Title Page with Teacher Instructions - Student Handout that has Two Data Sets (with 20 items each) - Dot Plot Worksheet (for students to graph and compare two dot plots) - 2-Page Measures of Central Tendency and Variation Worksheet - Reflection Worksheet - Answer Key If you enjoy this statistics lesson, check out other fun options in my store: Middle School Math Stations or Centers for Statistics and Probability: 5 Math Centers that are a great way to prepare for a unit test! Create Dot Plots and Histograms: 6th Grade Statistics and Graphing Practice: Students create and carry out their own survey and then graph it two ways! Identifying and Writing Statistical Questions for 6th Grade Math: Help your students learn ways to collect data and try it out!
Author Grace Under Pressure
Tags Statistics, Compare Data Sets, Financial Literacy, Dot Plots, Statistics Word Problems, Compare Data Distributions, Mean, Median, Interquartile Range, Graphing Data

Graphing Throughout the Year for Primary
Math, Graphing, Grade 1, 2, Worksheets & Printables, Worksheets
Do you need some graphing fun that can be differentiated for your students? These graphing worksheetswill engage and motivate your students to have fun graphing data.They will graph bycounting the number of objects presented and then interpret the data by using bar graphs and by answering questionswith question sheets for EVERY GRAPH as well as answer sheets for all!They are easily differentiated by graphing , 5, 10 or 15 objects to support different levels of learning! As mentioned above, the graphs are presented as worksheets with images that you students will count and then create a bar graph to represent the data presented by the pictures. After creating the graph, there is a partner page that asks questions about the data represented on each graph. There are 61 pages of graphs to support your students’ understanding of graphing and interpreting data plus, answer keys for all. The graphs represent different seasons/months and can be differentiated as you need for your students. You can still use the same season or month graph, but some are a bit harder than others. Here is what is Included: ☀️ 61 pages of graphs and answer keys Total pages 122 129 pages including title Pages for each section. ☀️ 61 pages of questions to answer about each graph. ☀️ 6 graphs for summer ☀️ 8 graphs for fall including leaf, Halloween, Pumpkin and Thanksgiving graphs. ☀️ 4 graphs for winter including 2 holiday graphs. ☀️ 2 New year graphs ☀️ 3 Valentine’s Day graphs ☀️ 3 St. Patrick’s Day ☀️ 4 Spring ☀️ Included are 4 more Challenging graphs 1 for Summer, Spring, Valentine’s Day and St. Patrick’s Day ☀️Includes a cover if you choose to create a booklet for students and cover pages to add to a binder to keep your graphs organized! Ideas for Use: •For fun Math Rotations/ Centers •For holiday activities •Small groups that may need more focused practice with graphing •Morning work •Homework •To assess graphing skills •Partner activities •You can also ask your students to write the number models and show their work on the back of the sheets and explain their thinking. •Can be differentiated and used for remediation or enrichment Thank you for downloading, browsing or purchasing. Your support is greatly appreciated. I hope this brings a bit of Sunshine your way!
Author Sunshine and Lollipops
Tags Small Group Math, Holiday Graphs, Math Graphing, Math Centers, Math Morning Work, Primary Graphing

Grade 2 Math Worksheets – Dinosaur-Themed Set
Math, Addition and Subtraction, Addition, Geometry, Graphing, Money, Place Value, Subtraction, Time, Grade 2, 3, Worksheets & Printables, Word Problems, Worksheets
Give your grade 2 learners something to roar about with this set of 12 math worksheets. Designed to include a variety of math concepts presented in second grade curriculum , each worksheet meets current mathematics standards. Learners will enjoy the friendly dinosaur characters as they work to solve problems in addition, subtraction, graphing, telling time, greater than/less than, place value, and much more. They’ll also present their answers in different formats so as to bring variety to each worksheet. In some cases, learners will choose between two answers and color the graphic that shows the correct answer. Other times, they’ll circle the most appropriate answers. Some worksheets will require them to solve math equations while giving them space to show their work. These worksheets are versatile and were created to bring fun and ease to your educational environment. Most worksheets are available in color, while all worksheets are ready for you to simply print and go with a black & white format. Use them during a dinosaur themed unit, when you need a quick activity for a substitute teacher to use or provide them to learners as a review packet during the summer months. In any situation, you can’t go wrong. An answer key for each worksheet is also included. See the list below of details for each worksheet. WORKSHEET 1: learners will add 1-digit and 2-digit numbers and color the dinosaur bone which shows the correct answer. WORKSHEET 2: learners will solve the 1-digit and 2-digit subtraction equations. They’ll show their work and write their answers in the box each dinosaur is holding. WORKSHEET 3: learners will identify odd and even numbers and color the volcanos with the corresponding numbers. WORKSHEET 4: using the given prompts, learners will skip count and write their answers in the dinosaur footprints. WORKSHEET 5: learners will compare 2-digit and 3-digit numbers and write the greater than or less than symbols inside each dinosaur egg. WORKSHEET 6: using the given place value prompts, learners will color the dinosaur which shows the 2-digit or 3-digit matching answer. WORKSHEET 7: learners will read the prompts about a class trip to the dinosaur museum. They’ll then color the analog clock showing the matching time. WORKSHEET 8: using the given prompts, learners will circle which prices of dinosaur merchandise are greater than or less than the price in the prompt. WORKSHEET 9: learners will use the given prompts to write their answers in number form or expanded form. WORKSHEET 10: learners will fill-in the numbers in each sentence by identifying and counting the appropriate 2-D shapes. WORKSHEET 11: using the given information, learners will complete the bar graph. They’ll then answer questions using data about the graph. WORKSHEET 12: learners will solve the addition and subtraction word problems by showing their work and writing the correct answers. ANSWER KEY
Author Quail Trail Products
Rating
Tags Grade 2 Math, Dinosaurs, Addition, Subtraction, Geometry, Graphing, Place Value, Time, Money, Word Problems

8th Grade Math Review Choice Board Activities Digital & Printable
Math, Algebra, Geometry, Graphing, Grade 8, 9, 10, Activities, Worksheets, Worksheets & Printables
Keep your 9th-grade students engaged and prepared for this school year with this interactive, comprehensive review of Pre-Algebra. This digital choice board is designed to master foundational math concepts they'll need in high school while keeping them motivated to learn. Perfect for back-to-school or as a review for key skills, this activity makes reviewing, practicing, and reinforcing Pre-Algebra concepts seamless, fun, and flexible in its format. What's Inside This choice board covers a wide array of essential Pre-Algebra topics, each with various activities and resources. Students can explore each topic at their own pace, choosing activities that best suit their learning needs. Each topic is equipped with pages that allow students to interactively practice material without requiring logins, Google Classroom, or Microsoft Teams. Covered Topics: Real Numbers Exponents Ratios and Proportions Equations Inequalities Linear Relationships Roots Functions Systems of Equations Pythagorean Theorem Transformations Scatter Plots Volume Probability Scientific Notation Whether your students are working with equations, exploring probability, or coming to understand functions, this choice board has them covered. The activities vary to let teachers easily reach all different learning styles and allow students to review what they've learned and further their newfound knowledge. Key Features: Digital: Just share the link and they're good to go! Nothing to set up, nothing to lock, no passwords to remember. Great for independent work or collaborative groups. Printable Resources: We know sometimes students learn best with hands-on tools. That's why this choice board includes printable reference sheets and problem sets, ideal for at-home practice or extra support. These printable resources help reinforce key theories and provide a helpful tool students can refer back to as they work through each activity. Why Teachers Love It No Prep Required: No hours of setup required. Just send the link and let your students be off learning. Self-Paced Learning: Learners decide on order and types of activities to work on. It's student-driven and huge for building confidence. Give your students this interactive no-prep Pre-Algebra review choice board and set them up for success in a fun way to begin the school year!
Author Matemaths
Tags Matemaths, Choice Board, Digital, Printable, Pre Algebra

BC Grade 4 Math: Full-Year 4th Grade Real World Math Worksheets
Math, Patterns, Time, Money, Addition and Subtraction, Decimals, Multiplication and Division, Geometry, Graphing, Place Value, Grade 3, 4, 5, Worksheets, Worksheets & Printables
Are you searching for some new lesson ideas to include in your fourth grade elementary math class? If you are wanting to refresh your grade 4 mathematics program, here is a complete, full-year printable resource ready for you! This 4th grade math full-year curriculum is designed to work alongside your school's math textbook. These modern, real-world math printable activities will add to your students' learning since they show how each of the math skills from the textbook can easily apply to real-life situations. Plus, this resource includes quick & easy math tasks for you to use for formative assessment. This 80-page printable PDF is full of real-world math scenarios (summer road trip, reading bar graphs, planning a camping trip), math stations, a variety of easy games, and creative math projects that address every curricular competency standard in the British Columbia Mathematics 4 curriculum. 18 Different Topics are Covered Including: Place Value to 10,000 including Addition and Subtraction Ordering & Comparing Fractions Decimals to the Hundredths including Addition and Subtraction Multiplication & Division Addition and Subtraction: Math Facts to 20 Multiplication & Division: Math Facts to 100 Algebraic Relationships and Increasing & Decreasing Patterns One-Step Equations Time (Digital and Analog) Regular & Irregular Polygons including Measuring the Perimeter Identifying Line Symmetry Reading and Creating Bar Graphs Probability Experiments Financial Literacy Grades to Use With: This full-year curriculum is designed for fourth grade math classes in the province of British Columbia, Canada. However, it is full of math activities that meet 3rd, 4th, and 5th grade US common core state standards, so it could easily be used in many classrooms! What's Included: 80-Page PDF with 20+ Different Activities Answer Keys (where applicable) If you enjoy this full-year math curriculum, check out my other ones: BC Grade 5 Math BC Grade 6 Math BC Grade 7 Math
Author Grace Under Pressure
Rating
Tags Math, Math Games, British Columbia, Math Text, Financial Literacy, 4th Grade Math, Grade 4 Math, Full Year 4th Grade Math, 4th Grade Math Worksheets, Grade 4 Math Worksheets

Spring Graphing
Math, Graphing, Kindergarten, Preschool, Grade 1, Worksheets & Printables, Worksheets
A Spring-themed set of worksheets to practice graphing. 1) April Showers Graphing - Color each item in the rainy pictures the same color. For each item color in one square of a box column. Answer the questions. 2) Sweet Graphing - Spin a paper clip and color one box below for each picture you get until you fill one of the columns. Write how many did you get from each picture. Answer the questions.
Author Cherry Workshop
Tags Graphing, Counting, Spring, Math, Graphing Spring
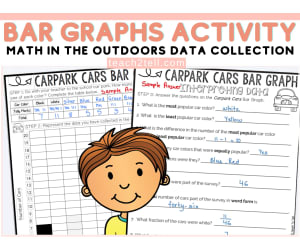
Bar Graphs Worksheets Data and Graphing Column Graphs Tally Marks
Math, Graphing, Measurements, Grade 2, 3, 4, 5, Worksheets & Printables, Worksheets, Activities
Looking for a data and graphing activity that gets your students moving and learning at the same time? These Bar Graphs Worksheets are the perfect mix of hands-on fun and curriculum-aligned skills practice! With a hands-on, real-world approach, your students will head outside to collect data using tally marks—yes, real data from your staff car park ! From Observation to Representation Your students will observe car colors and record their findings using tally marks . Then, they’ll transfer that data into a clear and colorful column (bar) graph . It’s a simple yet powerful way to connect real-life observation with structured math skills. Deepen Thinking with Data Interpretation Once the graphs are complete, students answer a series of questions to analyze and interpret the data. This step encourages them to think critically, make comparisons, and draw conclusions based on evidence—hello, higher-order thinking! What’s Included ✔️ Tally mark data collection sheet ✔️ Column/Bar graph template ✔️ Comprehension questions for data interpretation ✔️ US and British English versions for flexible classroom use Perfect For: Math centers or rotations Early finishers Outdoor learning experiences Grades 2–4 (or adaptable for other levels) Real-life, cross-curricular connections Why Teachers Love It This resource is more than just a worksheet—it's an experience. Students are actively engaged , moving , thinking , and connecting math to the world around them . Real data. Real math. Real fun. Bring graphing to life and turn your next math lesson into a mini adventure!
Author Teach2Tell
Rating
Tags Bar Graphs Worksheets, Data And Graphing Activities, Bar Graph Math Center, Graphing Data For 2nd Grade, Graphing Data For 3rd Grade, Math Worksheets Bar Graphs, Real-world Math Project, Picture And Bar Graph Worksheets, Common Core Graphing Lesson, Math Graphing Printables
Financial Literacy: Saving Up From a Part-Time Job Using Ratio Tables
Life Studies, Finance, Home Economics, Math, Graphing, Money, Fractions, Grade 5, 6, 7, 8, Worksheets & Printables, Word Problems, Worksheets
Here's an integrated lesson that teaches key financial literacy skills while also allowing students to practice using ratio tables and graphing them. Students get to choose an item they want to save up for that costs between $200-$300. They research the exact price and where they can buy it. Then, they use a ratio table to help calculate the sales tax on that item in their area. Next students complete two ratio tables based on hourly wages they could get for a part-time job. They graph the data from the 2 tables to see that when you are making more money per hour, you can save up for an item faster. This is good practice for plotting ordered pairs on a coordinate plane. After that, students create a new ratio table to see how many weeks they will have to work to save up for their item. Finally, they reflect on what they have learned about ratio tables, graphing, saving up, getting a part-time job, or hourly wages. A complete answer key is included! Grades to Use With: This lesson is designed to target the Common Core State Standards 6.RP.A.3.A and 6.RP.A.3.C It is perfect for a grade 6 classroom, or could be used as review and/or to teach financial literacy in a grade 7 or 8 classroom. It could be used for enrichment in a grade 5 classroom. Finally. it could be used in high school special education classes. What's Included: 5 Page PDF: Title Page, 3 Pages of Worksheets with Ratio Tables and Graphs included, Complete Answer Key If you enjoy this financial literacy activity, check out others in my store: My Budget Project for Elementary: Grades 3-6 Back to School Budget Activity Halloween Budget Activity My Party Budget: Decimals and Percentages Practice Financial Literacy: Financial Tradeoffs
Author Grace Under Pressure
Tags Ratio Tables, Ratios, Financial Literacy, Money Math, Real World Math, Saving Money, Part Time Job, Proportional Relationships, Money, Finance

Halloween Preschool Math Worksheets
Holiday & Seasonal, Seasons, Fall, Math, Early Math, Addition and Subtraction, Addition, Numbers, Graphing, Kindergarten, Activities, Worksheets & Printables, Worksheets
Preschoolers will have a ton of fun with these Halloween themed math worksheets. These preschool worksheets focus on number recognition, number formation, counting, picture addition, graphing and comparing numbers. What is Included: Number Mazes - There are two number mazes for students to color or dot the numbers in order to complete the maze. One maze is for numbers 1 to 10. The second maze is for 1 to 20. Roll and Cover - Students will roll a die and then cover the candy that matches the number rolled. Build It Up - Students will use counting cubes or other stacking manipulatives to build to the number on each candy piece. Counting Cut and Paste - Students will count the number of objects on each line then paste the correct number next to the pictures. Five and Tens Frames - Students will color the five or tens frames to show the number represented on each candy corn. Picture Addition - Students will glue the answers to each picture addition problem in the correct spot. Apple Graphing Worksheet - Students will count the pictures and then color the graph with the appropriate amounts. Missing Numbers - Students will write the missing numbers in each number sequence. Comparing Numbers - Students will count the objects and determine which group has more or less. Number Order - Students will glue the numbers in the correct order from 1 to 10. Shape Tracing - Students will trace each shape. Number Tracing - Students will trace each number from 1 to 9. Roll and Cover - Students will roll a die and then color one of the pictures above the number rolled. They will repeat until one column is completely colored in. Counting Worksheets - Students will color the correct number of objects on each worksheet These worksheets make great independent practice, emergency sub plans, and can even be used for homework. These Halloween themed worksheets are no prep. The teacher just simply needs to print out the desired pages and hand them to students to complete. The number mazes, roll and cover page, built it up page, tracing number pages and missing number pages can be laminated to create a reusable write and wipe activity.
Author The Connett Connection
Tags Preschool MAth Worksheets, Preschool Math, Counting Activities, Number Worksheets, Early Math Concepts, Halloween Worksheets
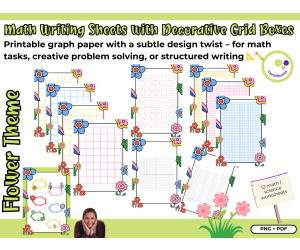
Math Writing Sheets with Decorative Grid Boxes
Seasons, Holiday & Seasonal, Summer, Spring, Common Core, Math, Early Math, Graphing, Basic Operations, Geometry, Homeschool Templates, Activities, Worksheets & Printables, Worksheets, Projects, Classroom Decor, Bulletin Boards, Posters, Teacher Tools, Templates, Diagrams
Math Writing Sheets with Decorative Grid Boxes Printable graph paper with a subtle design twist – for math tasks, creative problem solving, or structured writing 📐✏️ PNG + PDF These decorative math sheets combine practical structure with visual appeal. Designed especially for math lessons, they feature a box-style ruling (also known as graph or squared paper) and gentle decorative elements that frame the workspace without distracting from the task. The colors of the rulings match the surrounding design, giving each page a calm and balanced look. Whether you’re preparing math exercises, practicing place value, or creating space for geometry sketches – these sheets provide a flexible foundation. The structured grid supports clear number alignment and helps students organize their work, especially those who benefit from visual guidance. What’s included: A variety of printable decorative worksheets with math box rulings Rulings in colors matched to the design Subtle seasonal or subject-neutral decorations PDF format – for printing or use in digital notebooks (e.g. GoodNotes, Notability) PNG Format How I use them in class: I often reach for these sheets when I want to give a task a more finished or thoughtful appearance. Students use them for solving equations, drawing coordinate grids, or organizing data. They also work well for math journaling or scaffolded tasks, where a clear layout makes thinking visible. The design encourages careful work without being overwhelming – especially useful for students who struggle with messy layouts or find blank pages intimidating. Because the visuals are gentle and age-neutral, they’re suitable from upper elementary through secondary levels. They can also serve as project covers, learning logs, or a base for differentiated tasks. Sometimes, it’s these small details – like using a well-designed worksheet – that make students take their work a little more seriously. Best, Heike from Lernfitness Did You Know? I teach with a certified therapy dog, and together we create a positive and welcoming learning environment. 🐶
Author Lernfitness
Rating
Tags Activity Sheets, Spring, Summer, Decorative Pages, Writing, Drawing, Custom Classroom Materials, Seasonal, Worksheets, Math Writing Sheets

April Graphing
Math, Graphing, Grade 2, Worksheets & Printables, Worksheets
April Graphing Resource The April Graphing resource offers an engaging and efficient teaching toolkit that aims to improve Grade 2 students' understanding of bar graphs and pictographs. Every component within this resource celebrates the spring season, including themes of flowers and rain showers. Diverse Learning Games This versatile educational tool includes four unique games that enable your young learners to practice their graphing abilities in a whole-group setting or independently during math centers . The games come with options for studying both bar graphs and pictographs, equipped with different sets of questions to prevent repetition even when exposing students to both data representation tools. Caters To Learner Diversity This resource caters diverse skill levels amongst students by including solutions tailored for those who can easily carry out tasks independently as well as for those needing more support at first. Educational Charts included! To offer clarity in defining terms related to bar graphs and pictograph construction, the toolkit includes two easy-to-understand charts as references! Curriculum Standards Alignment: This teacher-aid aligns ideally with curriculum standard -'2MD10', offering concrete support for Grade 2 Math educators in enhancing student knowledge about graphing. A handy aspect of this product is its availability in PDF format. This allows you to easily share it across multiple devices whether you're homeschooling or teaching in schools ensuring no learning interruptions during transitions between traditional classrooms & remote settings if needed! In addition, available are resources like Grab Bag Graphs & bundles on Addition & Subtraction below the 20 marks. Gear up this April with our excellently designed graphing resources offering interactive fun-filled lessons aimed at mastering these crucial mathematical skills!
Author Teach With Baker
Tags April Graphing, Bar Graphs, Pictographs, Math Centers, Curriculum Standards
Quadratic Functions: The Discriminant Guided Notes + Homework Set
Math, Graphing, Grade 7, 8, 9, 10, Worksheets & Printables, Worksheets
Understanding Quadratic Functions through Guided Instruction This educational resource helps 7th-10th grade students better understand quadratic functions and the discriminant. The informative packet starts with detailed guided notes that walk students step-by-step through key concepts and examples. Learners will actively apply their knowledge as they progress through the materials. The notes conclude with a scaffolded homework assignment for students to practice the concepts on their own. This versatile resource can be used flexibly with whole groups, small groups, independent practice, or homework. The engaging materials aim to build students' conceptual knowledge and procedural fluency with quadratic functions in an accessible way. An answer key is included for instructional support. This teacher-created resource will facilitate rich mathematical learning.
Author Eddie McCarthy
Tags Quadratic Functions, Linear Equations, Graphing, Guided Notes, Math Homework

Algebra Real World Math Problem: 5th 6th 7th Gr Patterns & Expressions
Math, Algebra, Graphing, Grade 5, 6, 7, Worksheets & Printables, Word Problems, Worksheets
This lesson is an excellent addition to a pre-algebra unit in grades 6 or 7 to help show students a real-world application of using expressions, tables of values, and graphing to solve a simple, everyday financial literacy decision. Students are tasked with deciding how to pay to visit a new wave pool in the neighbourhood. They can pay a flat monthly fee or pay a smaller fee and then pay a small amount each time they go. The trick will be determining how often they are likely to go each month. Students get to: Analyze a realistic scenario Complete two tables of values Write a pattern rule in words and turn it into an expression with a variable Create a simple line graph to compare the two options visually Explain their decision in words using evidence from their mathematical work This lesson can be used in various ways: it can be used during full-class instruction or smaller group activities. It could be regular classwork, a homework assignment, or even a summative assessment. I liked to have students complete it near the end of our algebra unit to assess skills before the unit test and to have as an artifact for parent-teacher conferences. An extension challenge is offered that is specifically designed for early finishers. A complete answer key is also included for easy marking out of twenty points. Grades to Use With: This lesson is designed for upper elementary or middle school students in grades 5-7. It could also be used in high school special education classrooms. What's Included: 7 Page PDF with three page student assignment, title page, and complete answer key. If you enjoy this algebra activity , check out others in my store: Modelling Equations: Visual Balance Scales Independent and Dependent Variables in Grade 6 Math: Hockey Math Solving Systems of Equations Using Substitution Inequality Matching Game Exponent Board Game Writing and Solving Two-Step Equations
Author Grace Under Pressure
Rating
Tags Pre-algebra, Expressions, Tables Of Values, Graphing, Graphs, Algebra, Variables, Real World Math, Word Problems, 6th Grade Algebra
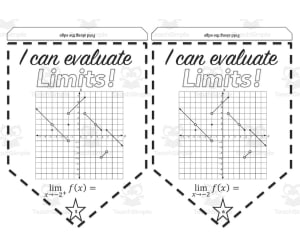
Evaluating Limits with a Graph Pennant Activity
Math, Algebra, Graphing, Grade 9, 10, 11, Worksheets & Printables, Worksheets
Evaluating Limits with a Graph Pennant Activity is a engaging 12-page printable math resource for algebra students to practice evaluating limits. It includes 11 pages with 22 limit problems printed on pennant flags at 2 per page. Students evaluate the limits, write answers on the pennants, and cut them out to display their math work. An answer key is provided for the teacher. Use the entire set or assign portions to individual students or small groups. Pennants can be assembled into a triangle display or hung in the classroom. This activity offers an interactive way for 9th, 10th and 11th grade algebra and precalculus students to graph linear and polynomial functions and strengthen their conceptual understanding of limits. Check out more secondary math resources at Mrs. B's store for algebra, geometry, fractions, and more engaging activities.
Author Mrs. B Secondary Math
Tags Math Pennants, Algebra Pennants, Graphing Activity, Graphing Equations, Evaluating Limits, Graph Limits, Algebra Worksheet, Math Decor