Gathering and Analyzing Data - Summative Task


About This Product
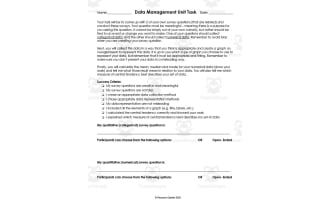
This is a Gathering and Analyzing Data Summative Task for your high school math students to complete. At the start of this task, students will be presented with two questions to ponder:
What are some issues that are important to you?
What have you heard about these issues in the media?
The Task That Students Will Be Presented With:
You will be choosing a topic of your choice to research with the goal of finding any possible bias in the data representation, that we see on media platforms. You will then think about what other variables or factors can be impacting this data, that are not being publicly considered in the media. As we learned in this unit, the way data is collected and represented can have a huge impact on how we interpret it at first glance. Additionally, when we are given further data on a related variable, our interpretation of the initial information may change.
You job will be to build as full of a picture on this topic as possible by collecting secondary data. By the end of the project, you should come to either a shocking conclusion about what we think we know, or, give us peace of mind that the media hasn’t diluted our realities after all!
A good topic will have:
Data representation from the media
Raw data from a reliable source
Data on related variables
The other slides you will have in this presentation are:
-- Topic Ideas
-- Data Sources
-- Soft Due Dates
I hope you enjoy!
Take A Look at My Best Sellers:
Positive Self-Affirmations Lesson
Three in a Row Addition and Subtraction Game
Choosing Reliable Sources Lesson
You can find more resources at my storefront here: https://teachsimple.com/contributor/resource-garden
What's Included
1 PowerPoint with 7 editable slides
Resource Tags
0 Reviews
Check out these other great products