Line Graphs Activity Plotting and Interpreting Data on a Line Graph


About This Product
Line Graphs Activity: Plotting and Interpreting Data on a Line Graph
This comprehensive, fun-filled activity for grades 2 through 5 is a mathematics teaching resource designed to make learning engaging and enjoyable. The highlight of the session is understanding line graphs using data from pizza sales.
The Activity Features:- A hands-on experience catering to multiple learning styles.
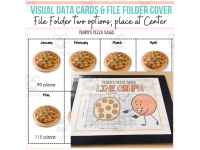
- Visual data cards that depict the number of pizzas sold for first-hand statistical information.
- Task cards with instructions on how learners can plot this data onto provided large or smaller line graph sheets.
Beyond just creating graphs, the resource focuses heavily on interpreting plotted data with response sheets included within the package facilitating efficient summarizing of findings.
Included Organizational Tools:- An optional file folder cover for organizing all necessary items at centers, boosting accessibility during classroom activities or homework tasks.
- ,
- A sample response in the form an answer key. ,
- A poster defining 'Line Graph'. ,
- Mathematical terminology cards that explain basic vocabulary associated with graphing concepts. ,
Offering either single large printing templates or two templates put together one sheet- helping save paper costs. In conclusion,
this activity expertly bridges practical sales recording experience over time and academic knowledge specific to line graph analysis.
What's Included
File folder cover (2 options): if placing all items in a file at a center
Single large task card (color and blackline) on a sheet outlining the task
Two small task cards (color and blackline) on a sheet outlining the task
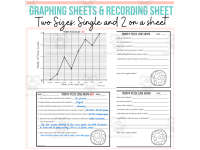
Line graph sheet to plot data (single- large and two small on a sheet)
Response Sheet to interpret data (single- large and two small on a sheet)
8 visual data cards featuring number of pizzas sold
Sample Response /Answer Key (single- large and two small on a sheet)
One poster on the definition of a Line Graph
Vocabulary/ mathematical terminology cards display (bonus)
Resource Tags
0 Reviews
Check out these other great products