Middle School Math Stations or Centers: Statistics and Probability


About This Product
Math stations are a great way to get students engaged as they move about the room and work collaboratively with their peers.
But they are a lot of work to prepare!
This ready-to-go set of 5 stations will supplement a unit about statistics and probability including probability using dice, spinners, and coins; calculating measures of central tendency- mean, median, and mode; and converting theoretical and experimental probability into percentages.
Ways to Use: You can break your class into 5 groups and have them rotate one at a time through the centres, giving them 10-20 minutes at each one. Or, start students at certain centres and then allow them to move around at their own pace as long as no one centre gets too full. I find these are a great resource as you are finishing your unit and preparing for the unit test.
Station 1: Students solve four word problems using probability and statistics. Students need to know how to calculate an average.
(optional: set out white boards for students to use)
Station 2: Students explore the probabilities involved when rolling two dice. (supplies needed: several 6-sided dice)
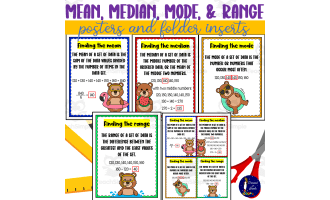
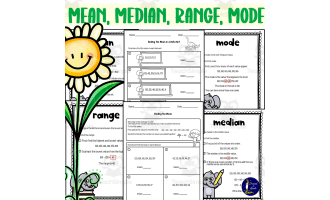
Station 3: Students graph data in a dot plot and calculate measures of central tendency. Students need to know the difference between mean, median, and mode and how to make a dot plot.
Station 4: Students play a probability game and compare theoretical and experimental probability (and fairness).
(supplies needed: paper clips for spinners)
Station 5: Students apply what they have learned to a real-life situation (flipping coins), and practice writing and drawing about their mathematical thinking.
(optional: set out laptops or tablets for the online game extension)
***Answer Key Included***
Grades to Use With:
These stations will work well in grades 5-8 or high school special education classrooms.
Standards:
CCSS5.MD.B.2
Make a line plot to display a data set of measurements in fractions of a unit (1/2, 1/4, 1/8). Use operations on fractions for this grade to solve problems involving information presented in line plots. For example, given different measurements of liquid in identical beakers, find the amount of liquid each beaker would contain if the total amount in all the beakers were redistributed equally.
CCSS6.SP.A.2
Understand that a set of data collected to answer a statistical question has a distribution which can be described by its center, spread, and overall shape.
CCSS6.SP.B.4
Display numerical data in plots on a number line, including dot plots, histograms, and box plots.
CCSS6.SP.B.5c
Giving quantitative measures of center (median and/or mean) and variability (interquartile range and/or mean absolute deviation), as well as describing any overall pattern and any striking deviations from the overall pattern with reference to the context in which the data were gathered.
CCSS7.SP.A.1
Understand that statistics can be used to gain information about a population by examining a sample of the population; generalizations about a population from a sample are valid only if the sample is representative of that population. Understand that random sampling tends to produce representative samples and support valid inferences.
CCSS7.SP.C.5
Understand that the probability of a chance event is a number between 0 and 1 that expresses the likelihood of the event occurring. Larger numbers indicate greater likelihood. A probability near 0 indicates an unlikely event, a probability around 1/2 indicates an event that is neither unlikely nor likely, and a probability near 1 indicates a likely event.
CCSS7.SP.C.6
Approximate the probability of a chance event by collecting data on the chance process that produces it and observing its long-run relative frequency, and predict the approximate relative frequency given the probability. For example, when rolling a number cube 600 times, predict that a 3 or 6 would be rolled roughly 200 times, but probably not exactly 200 times.
If you enjoy these math stations, check out my other packs of 5 stations each for intermediate and middle school math classrooms:
5 Math Stations for Factors, Multiples, Prime and Composite
What's Included
7 Page PDF:
Title Page/Instructions
5 Stations
Answer Key
Resource Tags
0 Reviews
Check out these other great products