Spirometer Tracing
- Grades
- Grades 9–11, High School
- File type
- Microsoft PowerPoint
- Editable
- Yes


- Subject
- Science, Life Sciences, Human Body
- Topic
- spirometry, respiratory function
- Resource types
- Teacher Tools, Lesson Plans
- Editable
- Yes
About this resource
What's inside this resource
Spirometer Tracing - A Comprehensive Teaching Resource
Spirometer Tracing is an engaging teaching resource for grade 9 to 11 science teachers. Understanding spirometry, traces and insights they provide about a sportsperson's breathing patterns during physical exertion forms the basis of this content.
The resource comprises of a robust 19-slide PowerPoint Lesson Presentation designed for interactive classroom lessons. It can serve as a primary instruction guide or supplement existing curriculum. At-home educators or tutors can also make good use of this resource.
Brief Overview:
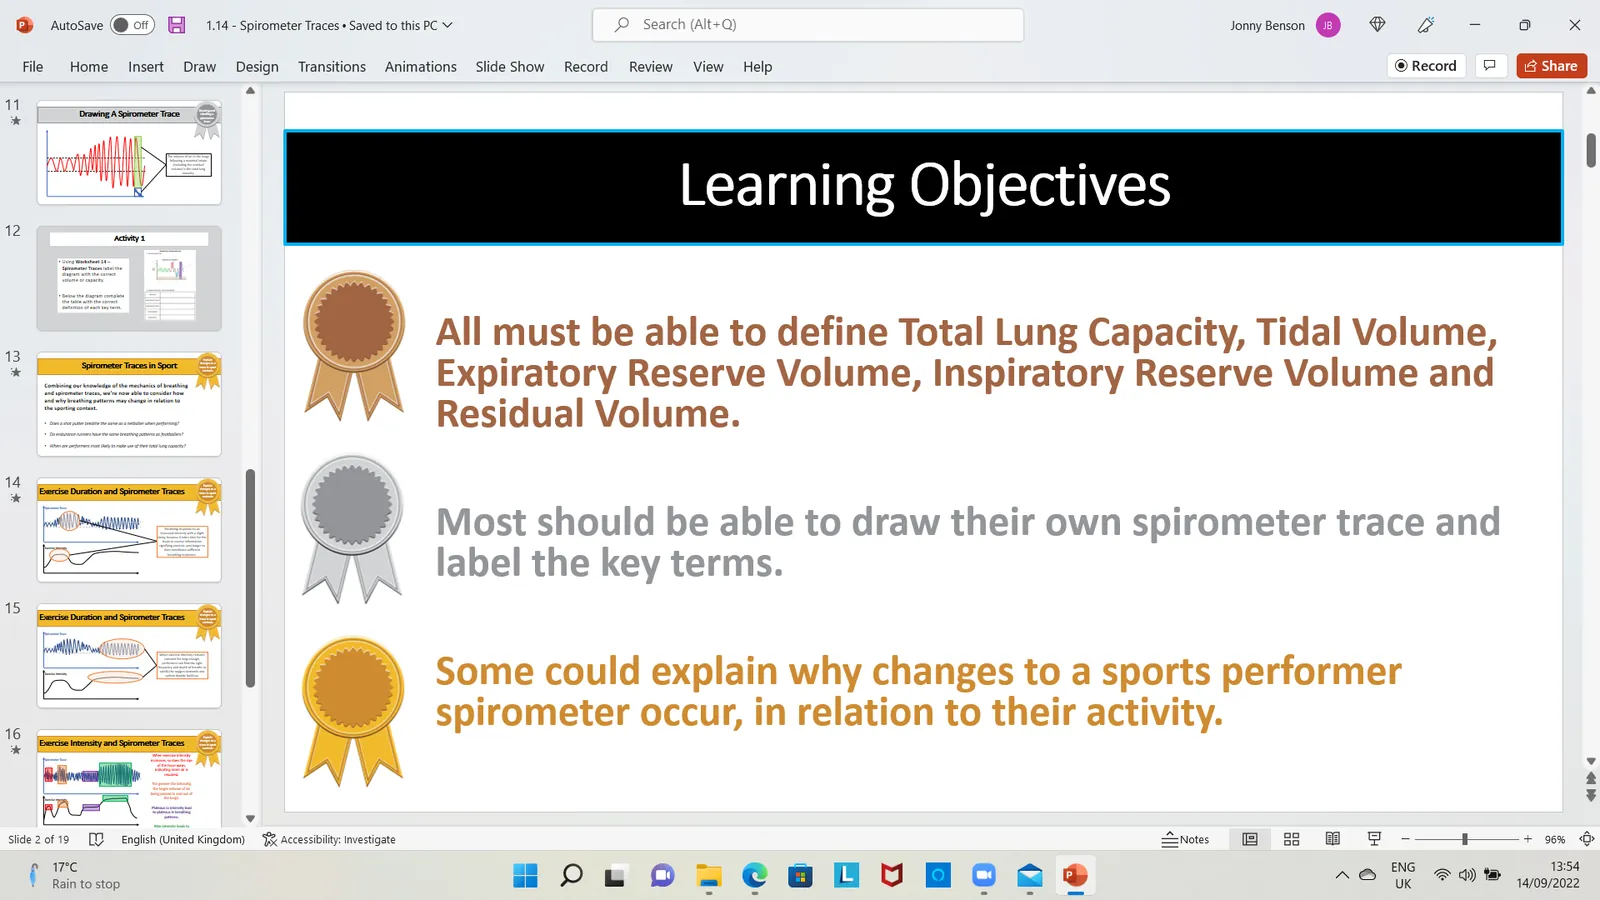
- Total Lung Capacity
- Tidal Volume
- Expiratory Reserve Volume
- Inspiratory Reserve Volume
- Residual Volume
This structured lesson plan begins with fundamental concepts at the heart of spirometry tracing, moving up towards more complex scientific knowledge about human body functions and capabilities specific to respiration.
Learner Proficiency Goals:
- All learners should understand basic spirometry terms and concepts
- Moderate learners should be able to draw their own spirometer trace labeling key components independently Note:
Intriguingly certain advanced learners would even be able to comprehend and explain changes in an athlete's spirometer based on the nature of his/her activity.
Related resources
More resources teachers may find useful
22 related resources were found using this product's title, contributor, categories and tags.



In the classroom
Teaching tips & learning objectives

Learning objectives
Define total lung capacity, tidal volume, both reserve volumes, and residual volume
Interpret spirometer axes, wave direction, spacing, and height
Explain how breathing depth and frequency respond to exercise intensity and duration

Teaching tips
Build the graph in the slide sequence: axes first, then the breathing wave, tidal volume, reserve volumes, residual volume, and total capacity.
Compare two sport contexts by naming the expected change in both wave height and wave spacing before drawing either trace.
Use the plateau diagrams to distinguish a steady exercise demand from a continuously rising intensity.

Skills covered
Respiratory vocabulary — five measured volumes and capacities are defined and located on a trace.
Graph interpretation — axes and wave features are translated into time, lung volume, frequency, and depth.
Physiological reasoning — changes in exercise demand are connected with altered breathing patterns.

No reviews yet
Downloaded this resource? Tell other teachers how it went.
Resource details
Concepts & topics
Core concepts
 Core concepts
Spirometer trace
Lung volumes
Breathing rate
Exercise intensity
 Topics
Explore more
Categories this resource belongs to
Explore related searches
More to explore
You may also like