Theoretical vs Experimental Probability – 2-Page Task
- Grades
- Grades 4–7, Elementary, Middle School
- Pages
- 3
- File type
- Preparation
- Print ready


- Subject
- Math, Percentages, Fractions, Statistics
- Topic
- probability experiment, theoretical probability
- Resource types
- Worksheets & Printables, Word Problems, Activities
- Preparation
- Print ready
About this resource
What's inside this resource
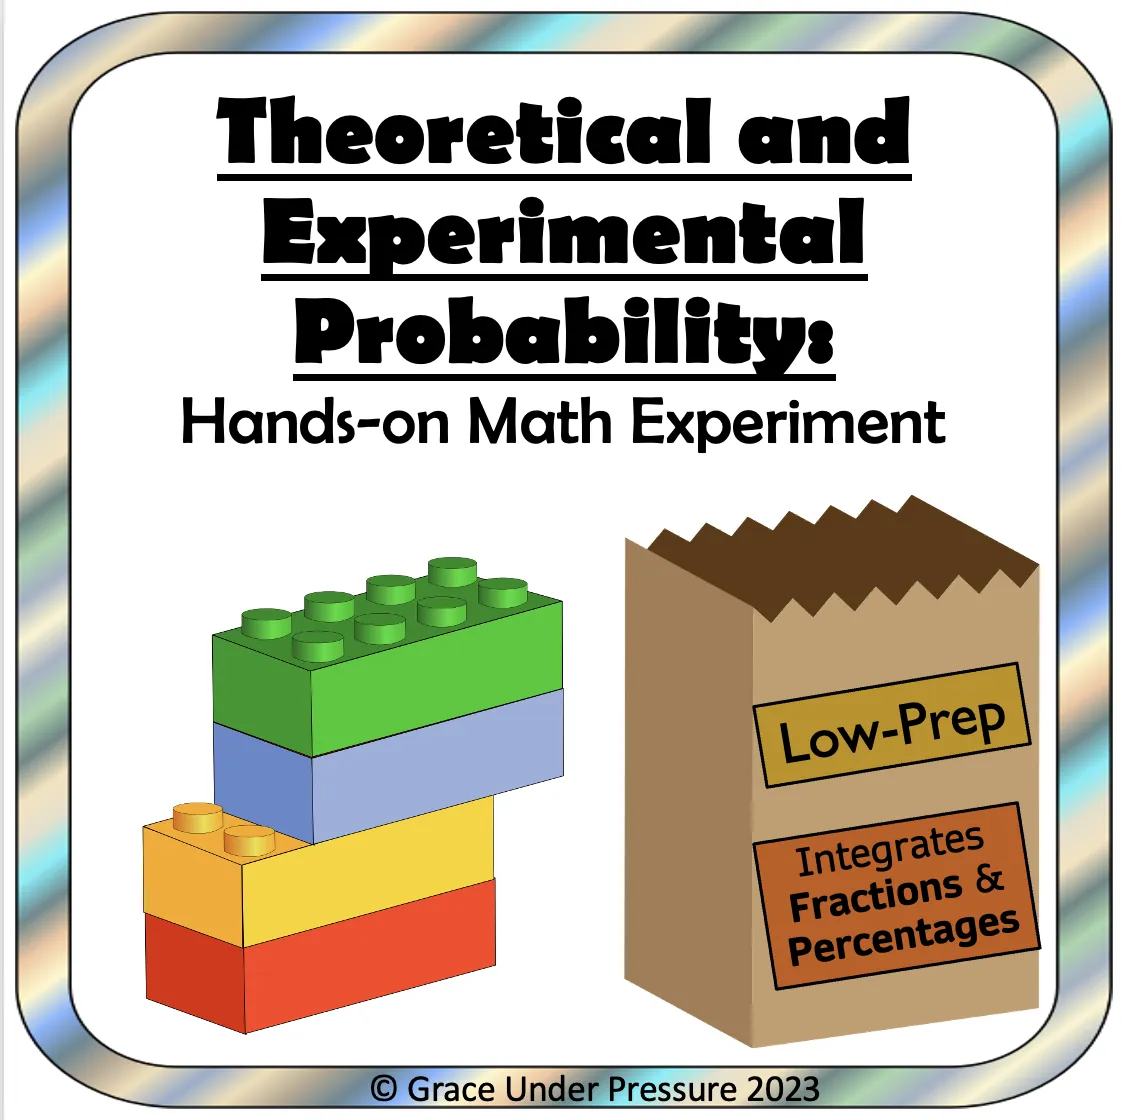
Theoretical and Experimental Probability: A Hands-On Math Exercise (with Fractions and Percentages)
This is a ready-to-use, engaging, two-page math activity designed for intermediate students in grade levels 4 through 7.
The product lets your students easily conduct a simple probability experiment that will help them grasp the concepts of theoretical and experimental probabilities. They will also tie this learning into other math topics by converting fraction results into percentages.
Items Needed:
Paper bags filled with items that are red, yellow blue, and green. Ideal items can be Legos, blocks or counters.
Bags should contain amounts of items that will easily convert from fractions to percentages- so 5 items, 10 items, 20 items, or 25 items are ideal.
Features:
Fits seamlessly into any probability or percentage unit
Serves as excellent practice for reinforcing equivalent fraction and percentage concepts
How to Use:
Split students into small groups. Give each group a bag of items and a worksheet (double-sided) for each member.
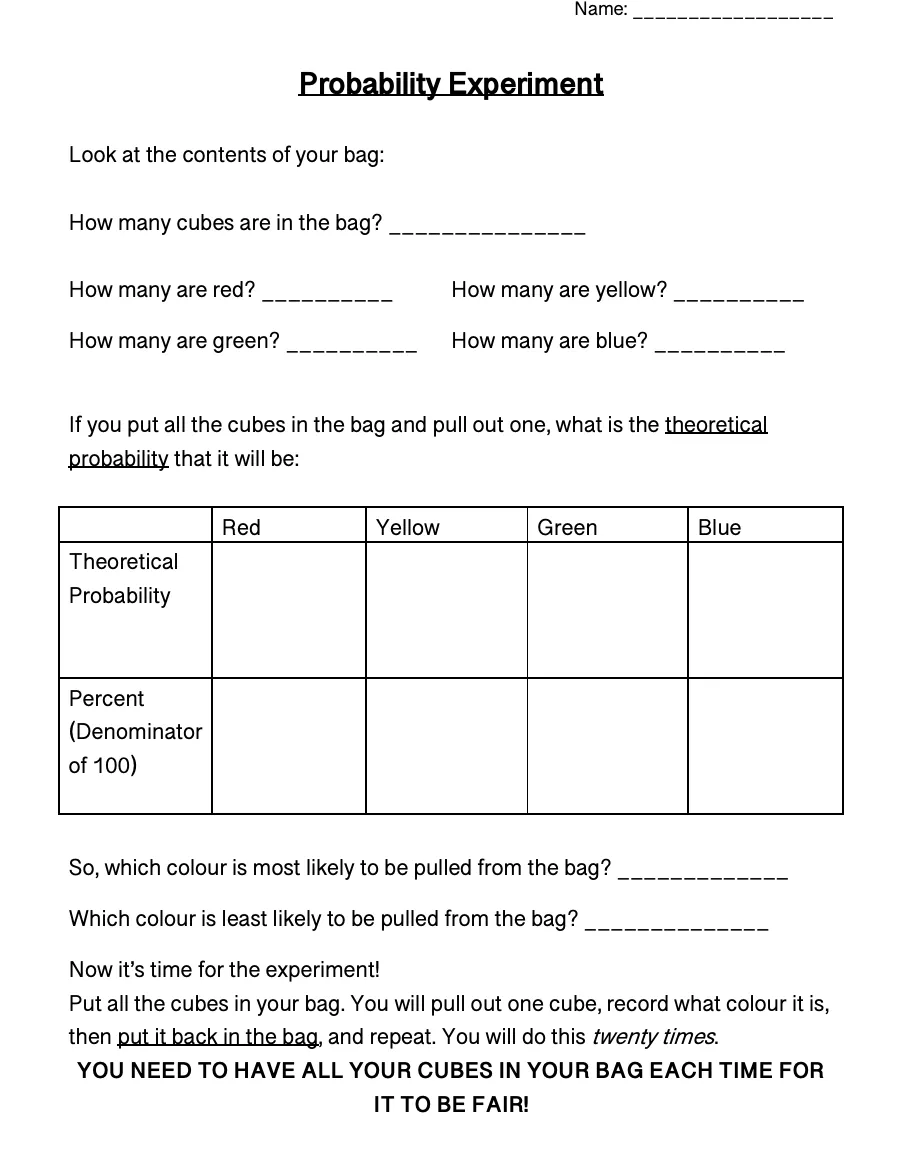
Students will explore their bag: count the total number of items, count how many there are of each colour, write each colour as a fraction, and convert that to a percentage. This is the theoretical probability of each event.
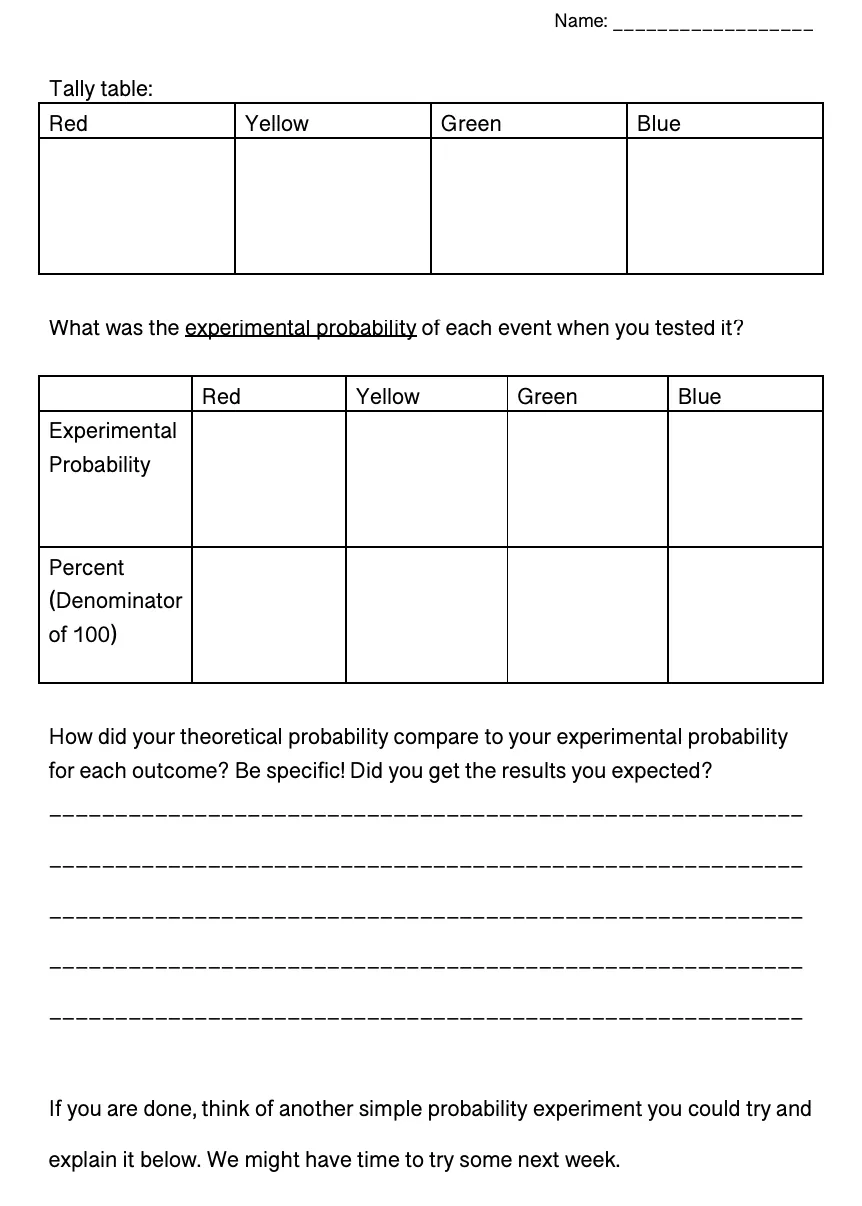
Then they perform the experiment: pulling one item from the bag and replacing it twenty times. They will use a tally chart to record the colours pulled.
They will turn their results (fractions out of 20) into percentages. This is the experimental probability.
Finally, students reflect on if the theoretical and experimental probabilities matched or did not and why that could be.
Grades to Use With:
This activity is designed for students in grades 4-7 who are learning about equivalent fractions, percentages, and probability experiments.
What's Included:
3 page PDF: Title Page and 2-page handout.
Copy double sided and you are ready to go!
Related resources
More resources teachers may find useful
24 related resources were found using this product's title, contributor, categories and tags.

In the classroom
Teaching tips & learning objectives

Learning objectives
Write the theoretical probability of drawing each colour as a fraction of the bag's total contents
Restate each probability as a percent with a denominator of 100
Predict the most and least likely outcome from the make-up of the bag before running any trials

Teaching tips
Bags of coloured cubes are prepared by the teacher; the sheets open by asking students to look at the contents of their bag, so nothing on the page substitutes for the physical materials.
Choosing a bag total that divides neatly into 100 — five, ten, twenty or twenty-five cubes — keeps the percent row manageable, since students are asked to rewrite each probability with a denominator of 100.
Read the capitalised fairness line aloud before groups start: replacing the cube after every draw is what makes the twenty results comparable with the theoretical figures. Compare the cube investigation with other situations in this probability color-by-number worksheet.

Skills covered
Theoretical probability — students count each colour in their bag and express the chance of drawing it as a fraction of the total number of cubes.
Fraction-to-percent conversion — a second table row requires every probability rewritten as a percent with a denominator of 100.
Tally-based data collection — twenty draws with replacement are logged in a four-column tally table for red, yellow, green and blue.
Good to know
Questions teachers ask about this resource
What does the teacher need to have ready before the lesson?
A paper bag of coloured cubes for each group, in red, yellow, green and blue. The sheets begin by asking how many cubes are in the bag and how many are of each colour, so the bags are assembled beforehand and the printed pages carry only the recording work.
Which spelling convention do the prompts use?
British spelling. The questions read "which colour is most likely to be pulled from the bag" and "record what colour it is" rather than the American form.
How many trials does the experiment run, and are the cubes replaced?
Twenty draws, each with replacement. The instruction is to pull out one cube, record its colour, put it back and repeat twenty times, followed by a capitalised reminder that all the cubes must be in the bag each time for the trial to be fair.

No reviews yet
Downloaded this resource? Tell other teachers how it went.
Curriculum
Standards, concepts & topics
Standards
 Standards
- 7.SP.C.5 — Approximate the probability of a chance event by collecting data on the chance process that produces it and observing its long-run relative frequency, and predict the approximate relative frequency given the probability. For example, when rolling a number cube 600 times, predict that a 3 or 6 would be rolled roughly 200 times, but probably not exactly 200 times.
- 4.NF.A.2 — Compare two fractions with different numerators and different denominators, e.g., by creating common denominators or numerators, or by comparing to a benchmark fraction such as 1/2. Recognize that comparisons are valid only when the two fractions refer to the same whole. Record the results of comparisons with symbols >, =, or <, and justify the conclusions, e.g., by using a visual fraction model.
- 7.RP.A.3 — Use proportional relationships to solve multistep ratio and percent problems. Examples: simple interest, tax, markups and markdowns, gratuities and commissions, fees, percent increase and decrease, percent error.
Core concepts
 Core concepts
Theoretical probability
Experimental probability
Fractions
Percentages
Tally charts
 Topics
Explore more
Categories this resource belongs to
Explore related searches
More to explore
You may also like