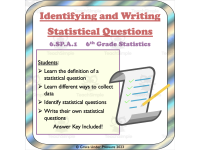
Statistical vs. Non-Statistical Questions – Grade 6

About This Product
This activity is designed to target Common Core State Standards 6th Grade Math Statistics 6.SP.A.1
It is a great opener for a unit on statistics and probability as it gets your students thinking about what statistics really are!
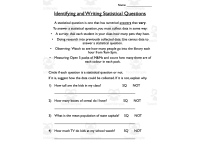
Students are taught what a statistical question is: a question that has numerical answers that vary.
They are shown ways to collect data for statistical questions: survey, using previously collected data such as a census, observations, or measuring.
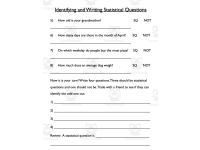
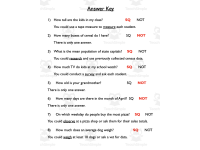
Next, 8 questions are included. Students need to identify if they are statistical questions or not. If they are, students think of how the data might be collected. If they are not, students explain what aspects of a statistical question are missing.
Finally, students write 4 questions of their own (one should not be a statistical question) and they trade with a friend to see if they can identify the odd one out.
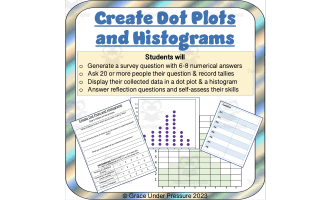
This product would be a great warm-up before my Create Dot Plots and Histograms assignment, as students will need to generate a statistical question for that project.
Grades to Use With:
This product is designed to target 6th Grade Math Common Core State Standards for Statistics and Probability. However, it can also be used for enrichment in grade 5 classes, or for review in grades 7 and 8.
What's Included:
4 Page PDF:
Title Page
2 Page Student Activity
1 Page Answer Key
If you enjoy this product, check out other data collection and statistics activities in my store:
Double Bar Graph Math Quiz for Grades 3-5: Differentiated
Math Project: Circle Graphs and Pie Charts
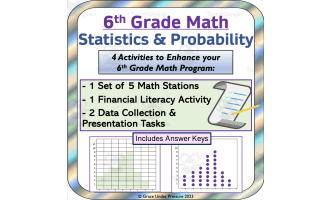
Middle School Math Stations or Centers: Statistics and Probability
Financial Literacy: Mean, Median and Interquartile Range of Hourly Wages
Line Graph Assessment: Real Life Math Problem for a Graphing Unit
Theoretical and Experimental Probability: Hands-on Math Task with Fractions and Percents
Resource Tags
0 Reviews
Check out these other great products