Math Champs! Tables, Charts, and Graphs


About This Product
Math Champs! Tables, Charts, and Graphs
Math Champs! Tables, Charts, and Graphs offers an enriching and practical approach to understanding various types of tables and graphs. Targeted towards Grade 6-8 students, this teaching resource focuses on the critical subject of Mathematics, specifically Statistics.
This versatile tool provides a hands-on approach to complex mathematical concepts. Its engaging practices include:
- Constructing tables from provided or self-researched data
- Crafting interactive stem-and-leaf plots
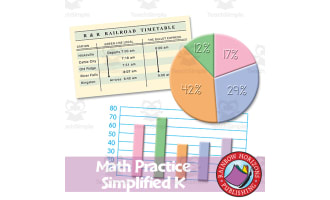
- Deciphering picture graphs/circle graphs
- Analyzing bar graphs/line graphs for trends tracking
This allows learners to understand statistical representations better. The resource lends itself seamlessly across various teaching scenarios including whole group lessons or smaller groups fostering discussion-based learning.
Versatility Applied in Teaching Scenarios:
- Rewards Whole Group Understanding: Can be used in collective lessons promoting collective comprehension.
- Promotes Discussion-Based Learning: The exercises can be broken down into smaller group tasks for stimulating debates.
- Inspires Inquiry-centered Learning: The resource offers exercises that steer the learner's curiosity.
- The tool also serves as a home-learning assignment for skill drilling.
The resource file is provided in PDF format thus easily accessible across various digital platforms such as smartboards or tablets during distance-learning periods.
In essence "Math Champs! Tables, Charts and Graphs" unravels the complexities of statistics, boosts practical skills among students as it bridges theoretical knowledge with real-world applications. Employ this resource and watch your learners evolve into confident "Maths Champs".
What's Included
Contains 1 Product File
Resource Tags
0 Reviews
Check out these other great products