search
user.png
vertical menu

Math Practice Simplified K - Tables & Graphs

Math Practice Simplified K - Tables & Graphs preview
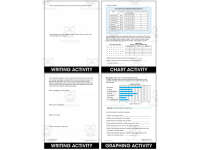
Math Practice Simplified K - Tables & Graphs preview 2
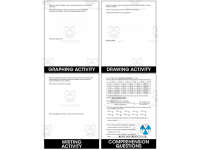
Math Practice Simplified K - Tables & Graphs preview 3

Math Practice Simplified K - Tables & Graphs preview 4

Look Inside · 10 pages · answer key included

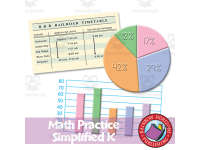
Cover of Math Practice Simplified K - Tables & Graphs for grades 5–8, showing a timetable and graphs
Cover of the tables and graphs practice book
Introduction to the math practice book explaining data interpretation, graph construction, and probability
Introduction and guidance for using the practice book
Contents listing tables, graphs, statistics, probability, and answer pages, plus related NCTM standards
Contents and standards for the math practice book
Opening activity asking students to explain what they know about tables and graphs and show a daily schedule
Opening reflection and class schedule activity
Table-reading practice using daily television viewing data for ages 2–17, with an example and six questions
Reading tables: television viewing data
Table-reading practice using the Star Diner menu and a 6% sales tax table to complete four guest checks
Reading tables: menu prices and sales tax
Table-reading practice using Romano’s Pizza prices to answer seven questions about costs and sharing bills
Reading tables: pizza menu word problems
Table-making practice completing chocolate factory payroll totals and a tally chart of daily hours worked
Making tables: payroll and hour frequencies
Table practice using ride-a-thon mileage and company pledges to answer ten questions about fundraising totals
Using tables: ride-a-thon fundraising problems

Answer key included

Answer key included
Attributes
Add To Collection
Add to collection Add to collection

About This Product

This mathematics-based resource is designed for grades 5-8. It’s imperative for students to have a strong foundation in basic math skills. This resource provides real-world activities to help students understand how to read and interpret data. Information from tables, charts and graphs are presented in this resource. Students will then present data in tables and graphs of their own making. Additional lessons on mean, median, mode and range are provided. Tables and graphs include: scattergrams, stem and leaf plots, line plots, box plots, histograms, among others. This resource is perfect to prepare students to succeed on standardized tests. An answer key is included. Aligned to National Council of Teachers of Mathematics (NCTM) Standards.

0 Reviews

Explore related searches
you may also like...

Check out these other great products