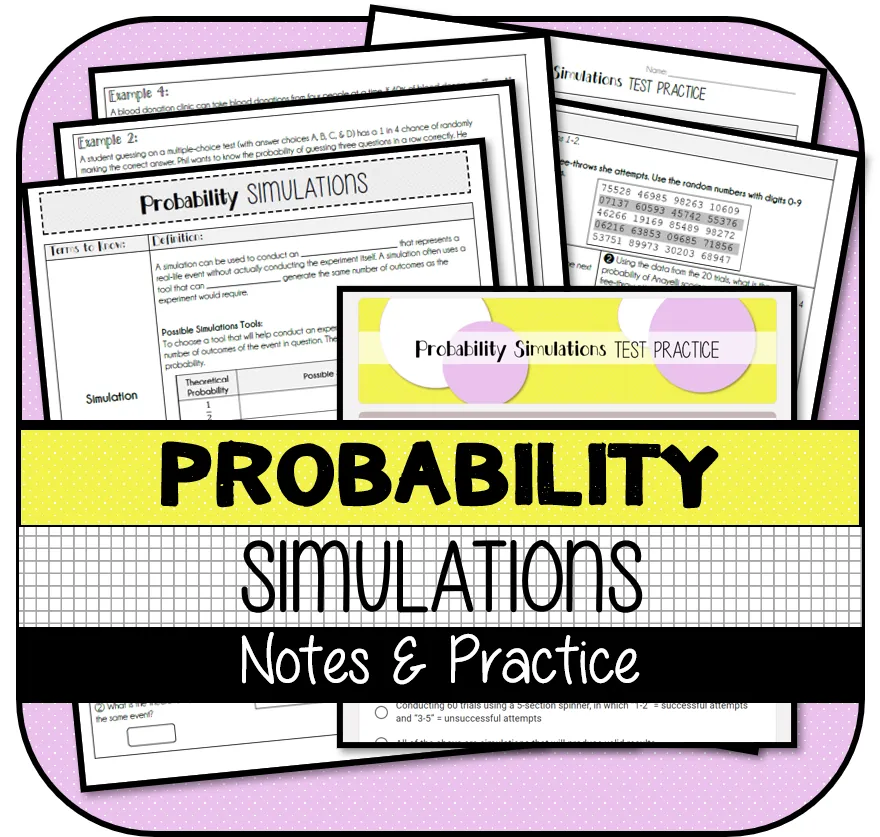
Probability Simulations NOTES & PRACTICE
- Grades
- Grade 7, Middle School
- Pages
- 12
- File type
- Answer key
- Included


- Subject
- Math, Fractions, Statistics
- Topic
- Probability, Simulations
- Resource types
- Worksheets, Worksheets & Printables
- Answer key
- Included
- Standards
- 7.SP.C.8
Product description
From the author
This resource was developed to meet the requirements of the 7th Grade Statistics & Probability Standard below:
CCSS.MATH.CONTENT.7.SP.C.8.C
Design and use a simulation to generate frequencies for compound events. For example, use random digits as a simulation tool to approximate the answer to the question: If 40% of donors have type A blood, what is the probability that it will take at least 4 donors to find one with type A blood?
Related resources
More resources teachers may find useful
24 related resources were found using this product's title, contributor, categories and tags.
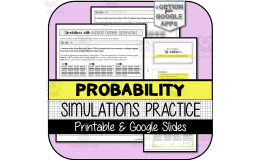


In the classroom
Teaching tips & learning objectives

Learning objectives
Select a simulation tool (coin, spinner, number cube, or random-digit generator) that models the probabilities of the outcomes in a given real-world event.
Calculate an experimental probability from simulation trial results and compare it to the theoretical probability of the same event.
Evaluate whether a proposed simulation design would produce valid results for a described situation.

Teaching tips
Work through Example 1 (predicting a family's birth order with a coin) as a class before assigning the remaining three examples independently, since the notes model the tool-selection reasoning there first.
Use the six true/false statements as a quick check for misconceptions — such as the belief that a simulation should always match real-life data exactly — before moving to the practice problems.
Have students work through the supplied random-digit tables and complete the trial records before checking the answer key.

Skills covered
Simulation-tool selection — students assign tool outcomes to represent the probabilities in a real event (e.g., a two-sided coin for a 50/50 birth-order event).
Experimental-versus-theoretical probability comparison — examples and test questions compare experimental results with theoretical probabilities.
Data interpretation from simulation trials — students read tables of trial results (e.g., 50 trials of a coin flip) and compute a probability from the recorded outcomes.
Good to know
Questions teachers ask about this resource
Do the practice problems require students to generate their own random data, or is it provided?
The practice supplies random-digit tables. Students use these to conduct the indicated trials and calculate results; other questions supply completed trial data to interpret. Generating a fresh set of data can be an optional extension.
Does the test-practice section ask students to critique a simulation design, not just calculate probabilities?
Yes — one question asks which of four proposed simulations would NOT produce valid results for a given free-throw scenario, requiring students to judge the design itself rather than just compute an answer.

No reviews yet
Downloaded this resource? Tell other teachers how it went.
Curriculum
Standards, concepts & topics
Standards
 Standards
- 7.SP.C.8
Core concepts
 Core concepts
Probability simulation
Experimental probability
Theoretical probability
Compound events
 Topics
Explore more
Categories this resource belongs to
Explore related searches
More to explore
You may also like