3,943 products added recently
Statistics Project
Help your students understand the power of data with statistics projects that involve real-world information. This collection includes surveys, probability experiments, and graph creation. By integrating these projects into your lessons, you can enhance analytical skills and understanding of statistical concepts.
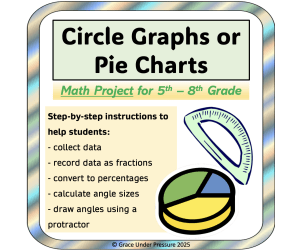
Math Project: How to Make Circle Graphs and Pie Charts
Math, Percentages, Geometry, Graphing, Statistics, Grade 5, 6, 7, 8, Worksheets & Printables, Worksheets, Lesson Plans, Teacher Tools, Projects, Activities
This fun math project includes clear step-by-step instructions to show your students how to make a circle graph. This is a great way to review several math skills while showing how useful they can be! Tasks include: - Writing a survey question: Your students learn to write a question that has exactly six possible answers. - Collecting data: Your students can ask the members of your class their question. They collect data using a tally chart. They need to ask exactly 25 people. - Recording results as a fraction: Once they have their data, they can turn each answer into a fraction with a denominator of 25. - Calculating an equivalent fraction: Then, they calculate an equivalent fraction with a denominator of 100. - Working with percent (written as a decimal): Finally, they turn that fraction into a percent in decimal form. They use this percent to multiply by 360 degrees in a circle (they can use a calculator for this part) to find out how many degrees each answer gets. - Drawing angles with a protractor: They carefully draw the six angles in their pie chart, one by one. - Labeling a graph: They label the graph to make it clear for others to read. Grades to Use WIth: This math project works well in the middle grades (4-8) when students know how to use protractors, calculate with fractions and decimals, and make graphs. It could also work well in a high school special education classroom. What's Included: A total of 5 pages. in PDF Format Title Page Survey Page Equivalent Fractions Page Decimals Page Circle Graph Template Standards: 7th Grade Geometry: Draw shapes with specific conditions. 4th Grade Fractions: Write equivalent fractions. Write fractions as equivalent decimals out of 100. 6th Grade Ratios and Proportional Relationships Work with percentages.
Author Grace Under Pressure
Rating
Tags Math Project, Pie Charts, Graphing, Data Collection, Percent, Angles, Protractor, Equivalent Fractions, Circle Graphs Math, Circle Graphs

High School Financial Literacy: Stock Market Project- Investing
Finance, Life Studies, Home Economics, Decimals, Math, Money, Addition and Subtraction, Statistics, Special Resources, Life Skills, Grade 9, 10, 11, 12, Worksheets & Printables, Worksheets, Projects, Activities
This engaging and useful stock market project can teach your high school students all about several financial literacy topics: investing their savings, buying shares (stocks) in a company, calculating their gains and losses, investment volatility, calculating the mean, length of investment (time horizon) and more! How to Use: 1. On Day 1, have your students complete the first worksheet. They can use the included website to look at a variety of different stocks and their historical performances. They will divide up their thousand dollar investment between two different companies, and calculate how many shares the will be able to buy from each company they picked to invest in. 2. Then, schedule three separate classes over the next month or so to check on the stocks. Each time, your students will record that day's current share price and calculate their shares' current investment value. 3. On the final day, your students will calculate how much money they have gained or lost during the project. Then, each student will provide their gain or loss which will allow the calculation of your class's average stock performance during the project. [You can project the included table on a board and each student can fill in their gain or loss.] 4. Next, students will find out how the stock market performed on average during the timeframe of the project. They will utilize data from the S&P 500 to see if their class's average was better or worse than the stock market itself. 5. Finally, students will write a reflection about this project. A variety of prompts are included to help your students think about volatility, lower risk of ETFs, and the importance of thinking about how long one can invest their money. Sample calculations are provided for each step to help model for your students. What's Included: 6 Page PDF- Ready to Print and Use! 1) Teacher Instructions 2) Day 1: Buy Stocks 3) Check on Stocks 3 Times 4) Calculate Gains, Losses, and Class Average 5) Compare to US500 Performance 6) Written Reflection
Author Grace Under Pressure
Tags Life Skills, Investing, Invest, Stock Market, Financial Literacy, Personal Finance, Personal Finance Worksheets, Financial Literacy Worksheets, Math Project, Applied Math

Data Science Fundamentals for Kids - Statistics book
Statistics, Math, Time, Money, Measurements, Fractions, STEM, Homeschool Curriculum, Grade 4, 5, 9, 10, 11, 12, Projects, Activities, Lesson Plans, Teacher Tools, Outlines, Quizzes and Tests, Tests, Worksheets & Printables, Workbooks, Word Problems
Unleash the fascinating world of data science and statistics for children with "Data Science Fundamentals for Kids - Statistics" by Syed Hammad Rizvi. Featuring a detailed 370-page course manual tailored specifically for students from grades 5-12, this invaluable resource simplifies complicated concepts into a series of fun and easy-to-master tutorials. Starting with introductory elements of data types and sources and progressing all the way from advanced concepts of probability studies to visual representation techniques of pictographs, bar graphs, line graphs, pie charts, histograms, and box plots, measures of central tendency of mean, median, and mode statistics, dispersion of range, quartiles, and interquartile range, sampling techniques with simple and stratified sampling methods, concepts of correlation and causality, responsible uses of statistics and ethics in statistics studies, and applied examples of AI and big data statistics analysis, this statistics guide for kids helps instill crucial STEM knowledge for their. Perfect for homeschooling students, this statistics guide for kids also makes for a stellar choice for teachers and scholars seeking resources for statistics learning for children, guidebooks for beginner-level analysis of statistics and frequency analysis for students, books for kids related to STEM information, and resources for probability tutorials for middle school Why Parents/Schools Love It: Engaging and Age-Appropriate Content: Makes use of interesting stories and engaging examples to ease kids into otherwise frightening subject matter involving statistics, thereby giving kids a confidence boost in STEM fields. Comprehensive Skill Building: Encompasses all aspects of analysis from data acquisition to ethical analysis. Aiding students for future AI/data science employment purposes as well as for test preparation. Hands-On Tools/Projects: Includes guides with specific steps for creating illustrations for graphs, calculations for measures of variation, and completion of mini-projects. Encourages Critical Thinking: Teaching the importance of being unbiased, the difference between correlation and causation, and responsible data use helps prepare individuals for the data-intensive world that is the future of business and society. Flexible for Any Learning Style: Can be used for individual study, teaching groups, or supplementing a curriculum, with examples that show statistical principles in sports, games, and real life. Target Grades : Based on the complete analysis of the content, structure, and progression of the book-from very foundational concepts such as "What is Data?" and some simple tally marks in early chapters to more advanced ones like interquartile range, probability laws, sampling bias, correlation scatter plots, and ethical AI implications in later chapters-I believe the book addresses students from grades 5 through 12 most appropriately. The material progresses from simple, kid-friendly explanations using real-life analogies-such as recipes for data organization-to more sophisticated ideas, such as data skewness and mini data projects. As such, it is well-suited for middle schoolers, grades 5-8, who need to study visualization and averages, while high schoolers, grades 9-12, will appreciate the subjects of inference, causation, and what the future of technology holds based on these subjects. It is neither too simplistic for older children nor too advanced for younger ones, and the logic of progression allows for progressive learning. Copyright/Terms of Use This Book is copyrighted to Syed Hammad Rizvi. This resource is intended for home/personal use only. There shall be no changes, modifications, redistributions, or sales of this resource. In other words, it shall not be placed on the Internet where it might be accessible for downloading. “If you’d like to share this resource with fellow teachers, you are able to do so through purchasing additional licenses from Teachsimple.” Este producto llega felices a ofreceros por Syed Hammad Rizvi
Author Creative Book Store
Rating
Tags StatisticsForKids, DataScienceForChildren, STEMEducation, KidsStatisticsBook, DataFundamentals, ProbabilityForKids, DataVisualizationForBeginners, MeanMedianMode, EducationalBooksForKids, Grades5to12

Estimating Crowd Sizes using Jacob's Method
Math, Statistics, Grade 7, Activities, Projects
This investigation focuses on estimating the size crowds or even large collections of objects using some very basic mathematics. Jacob's Method of counting large crowds involves creating a grid that divides a given area into equal size squares. An estimate is made by counting the number of people in a few squares, then multiply the average obtained by the number of squares in the grid. What would happen if you use different size grids ? How do the estimates compare between pupils ? Could you get a more accurate estimate if you took all the estimates in the class and calculated th average? These and many more questions are presented on the worksheet provided along with a number of pictures of multiple objects and crowds with & without prepared grids for printing or viewing on a computer screen. This activity encourages sharing and comparing of data, refining methods of collection of the data and discussion about the accuracy and limitations of the method used. The package includes: Teachers Guidance Notes An introduction into Jacob's Method and a guide to the Worksheets Estimation Worksheet A Worksheet for the students on how to use Jacob's Method and record the data. A list of questions for discussion. Estimation Crowds To be used as a starter with the student's Estimation Worksheet containing 2 crowds of different densities. Pupils begin by guessing the size of each crowd, then estimate with a 6 square grid & 24 square grid using Jacob's Method. Estimation Samples 1 and 2 14 pictures to choose from all of which have a fairly even distribution: crowds of people, tomatoes,stars, trees, bricks, flowers, balloons, birds and more. Pupils estimate with no grid, a 6 square grid & 24 square grid, and are encouraged to experiment further with other grid sizes of their own. Estimation Sample 3 7 more pictures to choose from, but this time the distribution of the populations are not so even or regular, so its more challenging and opens up more questions. They include a football crowd, bubbles, two other crowds, a shoal of fish and a herd of wildebeast. There is lots to practice with & an excellent topic for critical thinking without the need for advanced math and can be extended into investigating bias in crowd counting. Note: All the documents are printable. To view the sample populations with the grids on a computer you will need the Adobe Acrobat Reader on a PC or Mac. Common Core Links at 7th Grade CCSS7.SP.A.1 Understand that statistics can be used to gain information about a population by examining a sample of the population; generalizations about a population from a sample are valid only if the sample is representative of that population. Understand that random sampling tends to produce representative samples and support valid inferences. CCSS7.SP.A.2 Use data from a random sample to draw inferences about a population with an unknown characteristic of interest. Generate multiple samples (or simulated samples) of the same size to gauge the variation in estimates or predictions. For example, estimate the mean word length in a book by randomly sampling words from the book; predict the winner of a school election based on randomly sampled survey data. Gauge how far off the estimate or prediction might be.
Author Jeff's Notebooks
Tags Math, Statistic, Data Collection, Estimating, Estimating Crowds, Jacob's Method, Estimating Population Size, Math Investigation, Jeff's Notebooks, Data Handling, Estimating Crowd Size, Crowd Size Estimation
Teen Financial Literacy Workbook
Math, Money, Statistics, Finance, Life Studies, Career, Business, Research, Special Resources, Life Skills, Homeschool Curriculum, Grade 8, 9, 10, 11, 12, Projects, Activities, Teacher Tools, Assessments, Diagrams, Lesson Plans, Literacy Readers, Presentations, Workbooks, Worksheets & Printables
Have you ever dreamt of having a long-term source of wealth? The Teen Financial Literacy Workbook Professional Edition is an affiliate partner – with great resources and actual financial literacy PDF workbook systems for students, parents, schools, owners, businesses, and anyone else who desires or needs basic money management skills! This 41-page workbook features engaging activities surrounding money management with 10 separate segments (All representatives of teen financial success) containing: -Money Mindset and Abundance Mentality -Types of Earning Income (active income vs. passive income, paycheck income vs. side hustle income) -Introduction to Budgets ( Rule of 50/30/20, tracking budgets and how to re-balance them) -Smart Ways to Save Money (compound interest & how to build an emergency fund; short vs. long-term financial goals) -Banking 101 (types of bank accounts; what is a debit card? Ways to avoid bank fees) -Credit Education (what is a credit score and how to improve it; credit cards; establishing a credit history) -Debt Relief Options (student loans; car loans; snowball/investment; interest vs. avalanche methods) -Introduction to Investment (stocks; bonds; mutual funds; risk-reward analysis) -Online Shopping Safeguards and Scam Prevention -Basic Understanding of Taxes (income tax, sales tax, basics of filing taxes) The Teen Financial Literacy Workbook has been designed to take the abstract concepts surrounding financial literacy and provide the tools and resources to develop responsible behaviors and create lifelong habits! The workbook can be used for instructional purposes (e.g., classroom-based, homeschooling; family financial nights; or independent teen learning) and is an excellent resource for teaching financial literacy. The workbook is easily accessible as an Instant Digital Download (PDF format, device/tablet/phone f, etc.) to print after downloading. No preparation work is necessary! Suitable for all types of life skill, career and technical programs, economics, or personal finance courses. What Makes It So Popular With Parents and Schools : Relatable to real life - Topics that teens need to prepare for the "real world", including: how to manage a paycheck, learn about credit scores, avoid debt traps, and the importance of investing and being safe online - are not often covered thoroughly in school. Supported interaction with parents and teens - Each module contains mentoring tips to help parents guide their teens without lecturing them making money discussions a way to bond more closely. Professionally designed - Provides a clean, visually appealing layout, interesting graphics and plenty of practical examples to keep teenagers engaged without sounding like a stuffy textbook. Easy to use - Print 1 pdf file for use in the classroom, at home or with family; there is no teacher preparation time. Demonstrated long-term results - Instilling habits that help young adults avoid making expensive mistakes as an adult (i.e. high-interest debt, low credit scores, missed opportunities for compound growth). This workbook is specifically designed for students in high school (grades 9–12). Ideal for students who will be using this workbook are freshmen, sophomores, juniors, and seniors (ages 14–18) that are preparing for their first job(s), preparing for college/university, getting their first car, or preparing to live independently from their parents. It is also appropriate for advanced 8th graders attending middle school life skills sessions and/or pre-high school financial literacy programs; however, this workbook is not appropriate for elementary/middle school because much of the content assumes students in these grades can: - Receive a paycheck. - Get a credit card. - Make decisions about going to college or trade school. Copyright/Use: This book is the intellectual property of Syed Hammad Rizvi. This book is intended to be used for personal, noncommercial, single-student use. You are prohibited from changing, redistributing, or selling any part of this book on the internet or making it available for download by the public. If you want to share this book with colleagues, you must purchase additional licenses from Teachsimple. Thank you for your adherence to the copyrights of these resources. Syed Hammad Rizvi acknowledges and appreciates your support.
Author Creative Book Store
Rating
Tags FinancialLiteracy, TeenFinancialLiteracy, FinancialLiteracyForTeens, MoneyManagement, TeenFinance, HighSchoolFinance, BudgetingForTeens, FinancialFreedom, PersonalFinance, MoneySkills

Statistics: Calculating Results
Math, Statistics, Grade 8, 9, 10, 11, Activities, Projects
Statistics: Calculating Results A unique teaching resource designed to aid middle and high school educators in teaching the value of thorough research and understanding statistical accuracy. This tool is most appropriate for grades 8 through 11, focusing on Math - specifically Statistics. Statistics: Calculating Results integrates real-life investigations with mathematical truths, aiming to help students discern true from false information they encounter online. A Hands-On Approach Activity The resource provides a hands-on approach that actively encourages student participation in data collection. Such fieldwork helps foster engagement and practical application of learning outside the classroom's environment, giving math principles real-world context. Upon completion of this exercise, students can compile their collected data together with those gathered by classmates. This collective task enables them to establish a definitive declaration about their findings concerning the conducted experiment . This educational activity prioritizes fostering an analytical mindset as much as it does solving equations. About The Repository Contents The repository consists of four pages including one page where students note down collected data from respondents; The remaining two pages offer comprehensive explanations supported by examples which assist teachers instructing these studies more effectively. Flexibility And Convenience: This activity can be implemented during classroom instruction for group work or independently assigned for homework – offering flexibility in pedagogical approaches. This tool comes in Word document file format allowing teachers to modify or adjust it according to each class's needs while retaining its core educational value.
Author The Education Lab
Tags Statistics, Data Analysis, Research, Misinformation, Real-world Application