
I have a habit of comparing facing a challenge to climbing a mountain. It’s a really great image, and one you can use to teach about the structure of a plot.
In this post, you’ll learn about the elements of a plot and how they are used in plot anchor charts.
Table of Contents
- Key elements of a good plot anchor chart
- Different ways of presenting plot in anchor charts
- Plot Anchor Chart Resources from TeachSimple
- 17 Teacher Created Plot Anchor Chart
- What happens in the story?
- Final thoughts on plot anchor charts
Key elements of a good plot anchor chart
There are certain elements that a good plot anchor chart should include:
- The important aspects of the plot:
Exposition
Rising action
Climax
Falling action
Resolution
- An explanation of each of the elements
- The concept of Beginning, Middle and End
- A graphic representation of the structure of a plot
This may be simple, where the structure is represented as a straight line forming a triangle.
It can also be more complicated, with the rising action line showing small spikes, which represent dramatic events along the way.
Different ways of presenting plot in anchor charts
The key to a well-crafted plot is the inclusion of the five elements, in the correct order. This is why most anchor charts and, in fact, any resources that teach plot, feature the characteristic ‘mountain’ shaped ‘picture’ of the development of the plot.
You can present the same content in different ways, though, which will engage the students’ attention.
Varying the graphic
If you look at some of the resources I have included below, you will see a few variations of the ‘mountain’ profile of the plot structure. There is a spiky mountain, a rounded hill and even a roller coaster. All of them have the same overall shape.
Create a new graphic
You can vary the graphic that is used and still present the structure of a plot clearly.
Try, for example, using the image of a spiral staircase that goes up to a water slide. The stairs represent the rising action. The spirals are events and consequences that occur on the journey. They can also represent conflict. Once the top (climax) has been reached, the water slide is the falling action, which ends in the pool of water at the end (resolution).
You could use the image of a game of Snakes and Ladders, where the plot rises with the ladders, but snakes cause blockages in the flow of the story, representing conflict.
An obvious image to use that represents the plot structure is a map of a journey. This gives wonderful opportunities to include obstacles in the way (representing conflicts) and getting past the objects (solutions).
Revisit the elements of plot
There are some elements of a plot that are most often not included in an anchor chart. You can add them to your chart, particularly for older grades.
The HOOK is an event at the beginning of a story that grabs the readers’ attention.
The INCITING INCIDENT is similar to the hook, but usually occurs after it. This is something that happens to begin the rising action.
MINI-CLIMAXES or DRAMATIC EVENTS are things that happen to characters along the way as the plot rises towards the climax.
Plot Anchor Chart Resources from TeachSimple
- The First 21 Days By First In Line
This is a resource that is great for introducing the very basic elements of plot. It is a lesson aimed at Kindergarten to grade 3.
- Teaching Plot Anchor Chart By First In Line
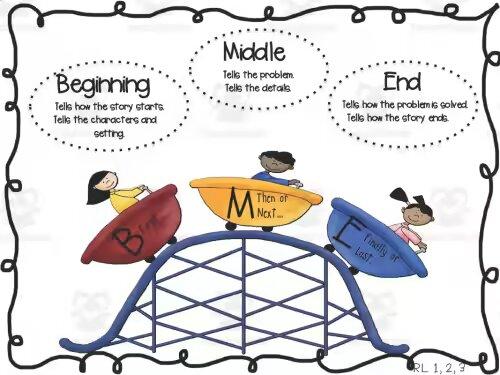
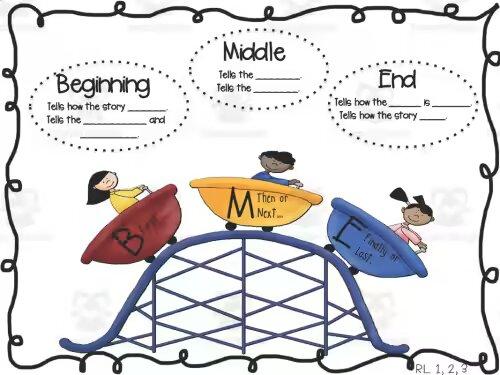
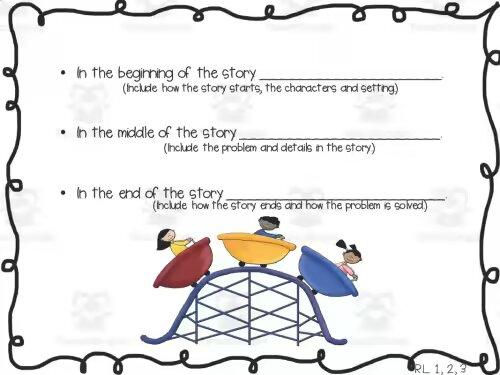
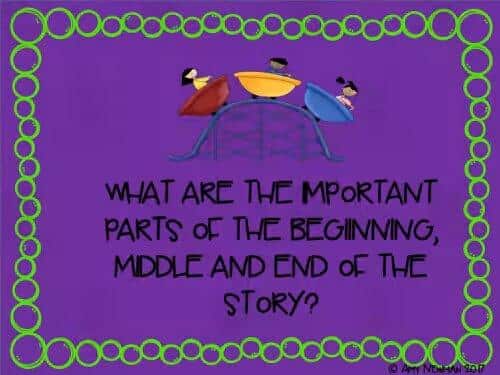
This is another resource that introduces the beginning, middle and end in a plot. It is aimed at kindergarten to grade 2, but could be adapted for higher grades. The three blank charts can be filled in following the pattern of the first, complete chart.
17 Teacher Created Plot Anchor Chart
- Teaching Plot With A Picture Book By Crafting Connections
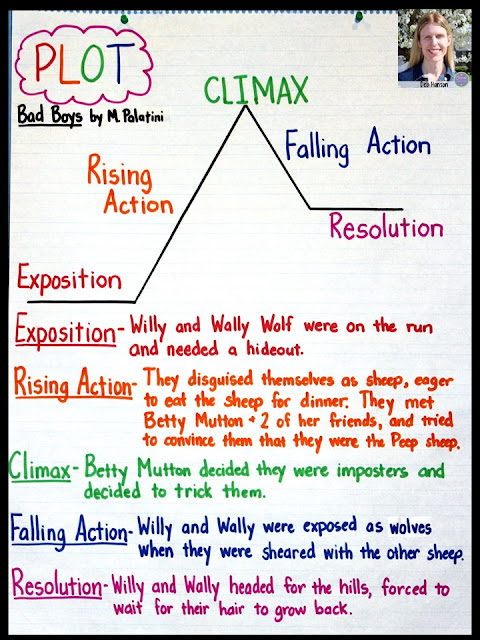
This resource gives an idea of how to use a picture book as the basis of teaching plot. This anchor chart uses color to identify and explain the different parts of a plot. The graphic of the structure can be followed easily and applied to any text.
- Elements Of Plot Anchor Chart By A Teacher’s Daze
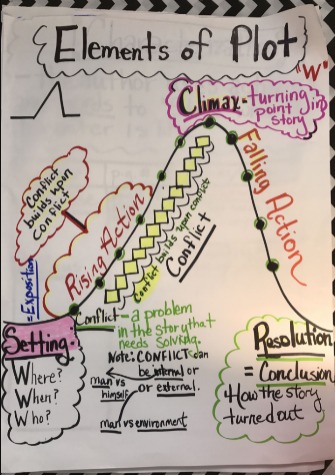
This resource uses a graphic presentation to indicate the elements of plot. This anchor chart is very graphic and seems to be a little busy. However, it shows how you can build up an anchor chart about plot using both graphics and words. The use of color and font is striking.
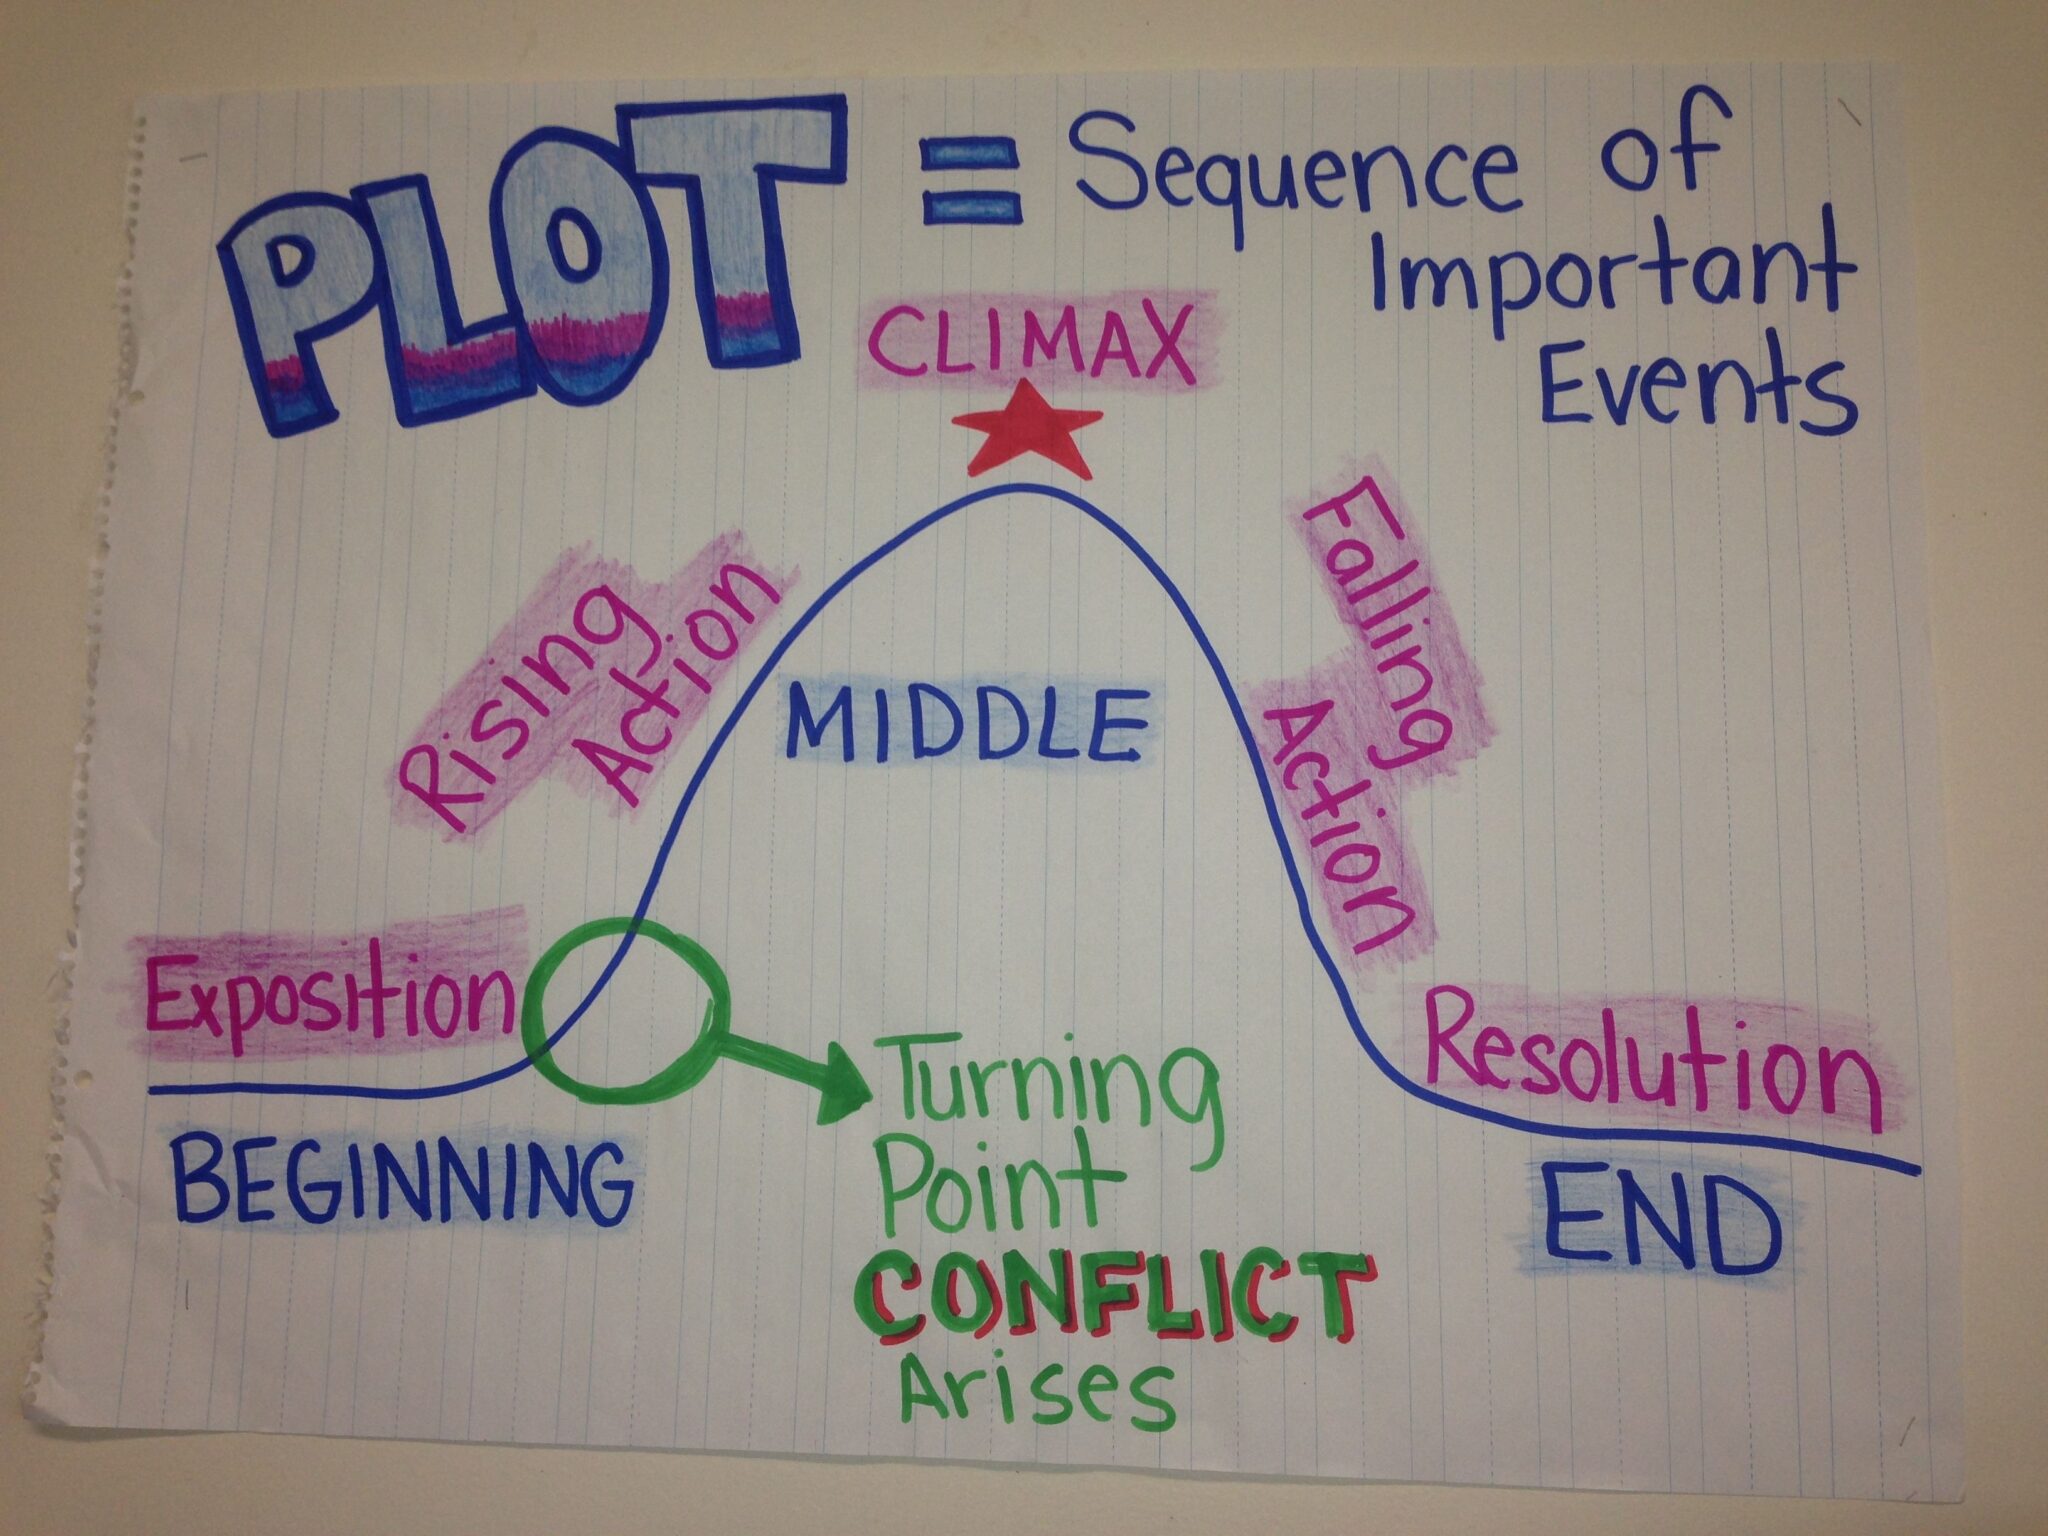
- Anchors Away Monday From Mrs. Westmoreland’s 3rd Grade
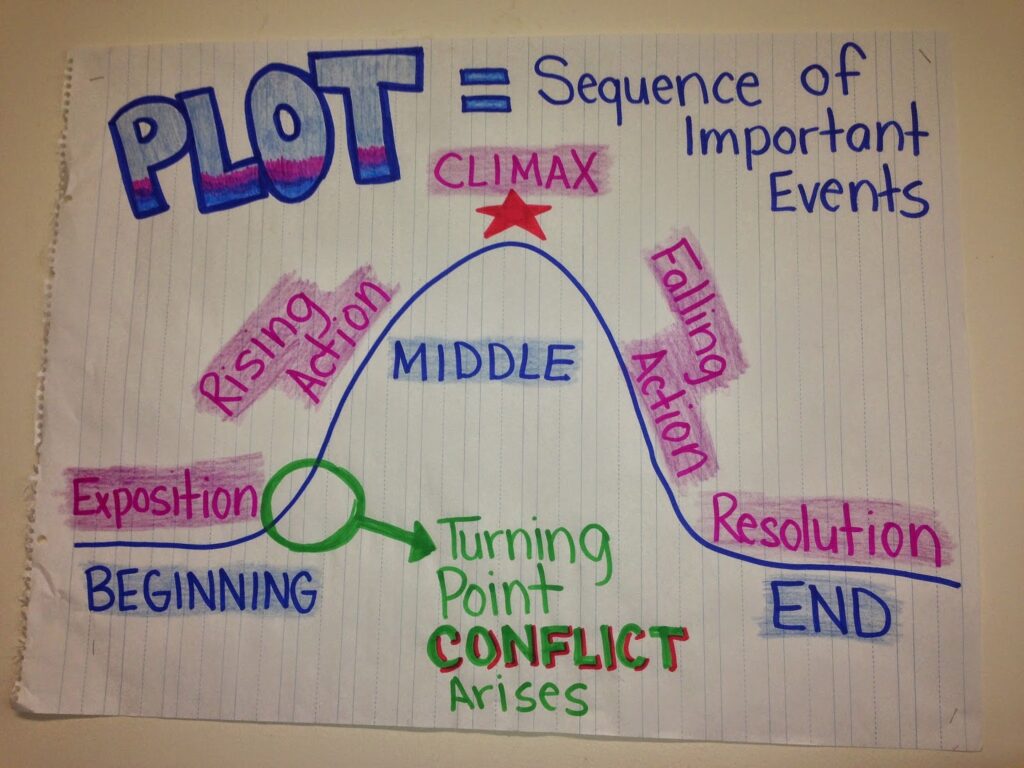
This anchor chart shows how plot is a sequence of important events. This is a simple and basic presentation of the main elements of plot, but I find it effective because of that. The different colors and fonts make the information clear.
- 4 Types Of Conflict From Global Classroom
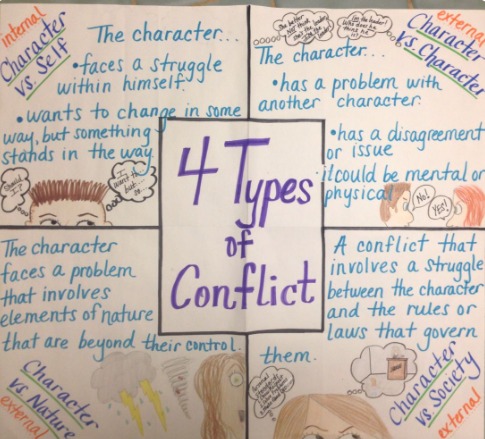
This resource focuses on types of conflict as an element of plot. I like the idea of having an anchor chart that is focused on one aspect of plot. This looks closely at four types of conflict that are part of the rising action.
- Plot And Explanations From Ms. Baldwin’s
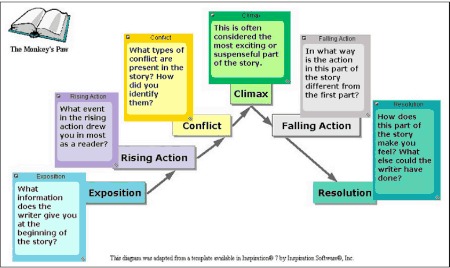
This Plot anchor chart is based on the triangular plot structure. This anchor chart is great for higher grades. It uses the triangular plot structure, which is represented simply. The descriptions and questions offered about each plot element are focused and useful. The almost geometric organization of the chart make it logical and easy to follow.
- The Plot Is Like A Rollercoaster From Liveworksheets
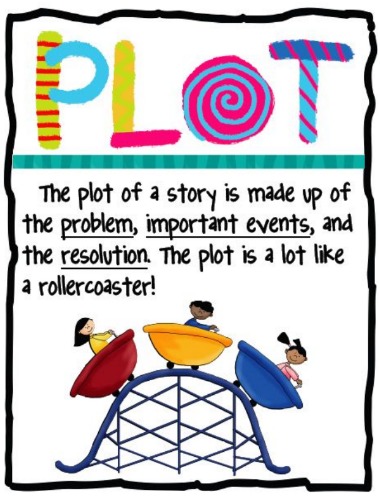
The anchor chart is a funky presentation of the essence of a plot. I love this resource as the perfect introduction to the idea of plot. It uses color and a fun image, which attract the attention. The important information is presented more seriously and convincingly.
- Conflict Climax From Mrs. Westmoreland’s 3rd Grade
This chart outlines two important elements of the plot: conflict and climax. This is another resource the looks more closely at two of the elements of plot. It is also a great pattern to follow for one or two anchor charts that focus on the elements.
- Plot Diagram Anchor Chart From Art Of It
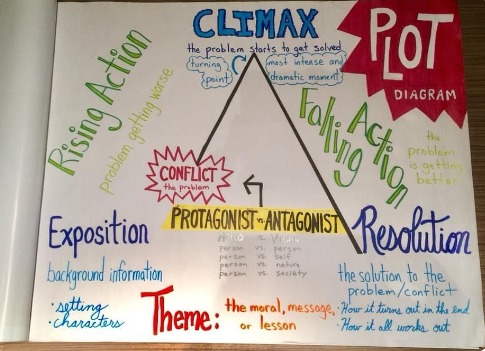
The main plot elements are dramatically presented on this anchor chart. This chart just looks great, because color, font and graphics have been used to really make the plot structure dramatic. It reflects an actual text. There is quite a lot of detail and the ideas of protagonist and antagonist, as well as theme, feature. You can use these or leave them out, as they are not part of the plot structure.
- The Plot Rollercoaster From 99 Worksheets
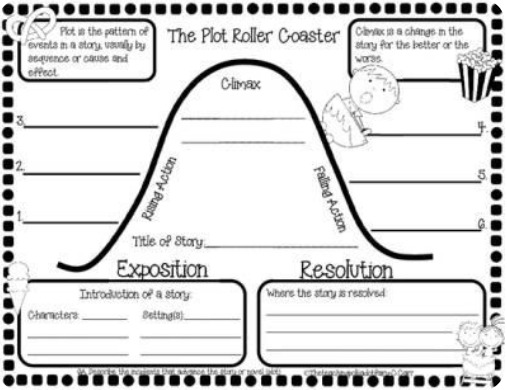
This resource is a blank template. If you are looking for a perfect blank template from which to develop a plot anchor chart, this is it. The main plot elements are indicated, but there is plenty of space to add explanations or examples.
- What Is Plot? By Dianna Radcliff
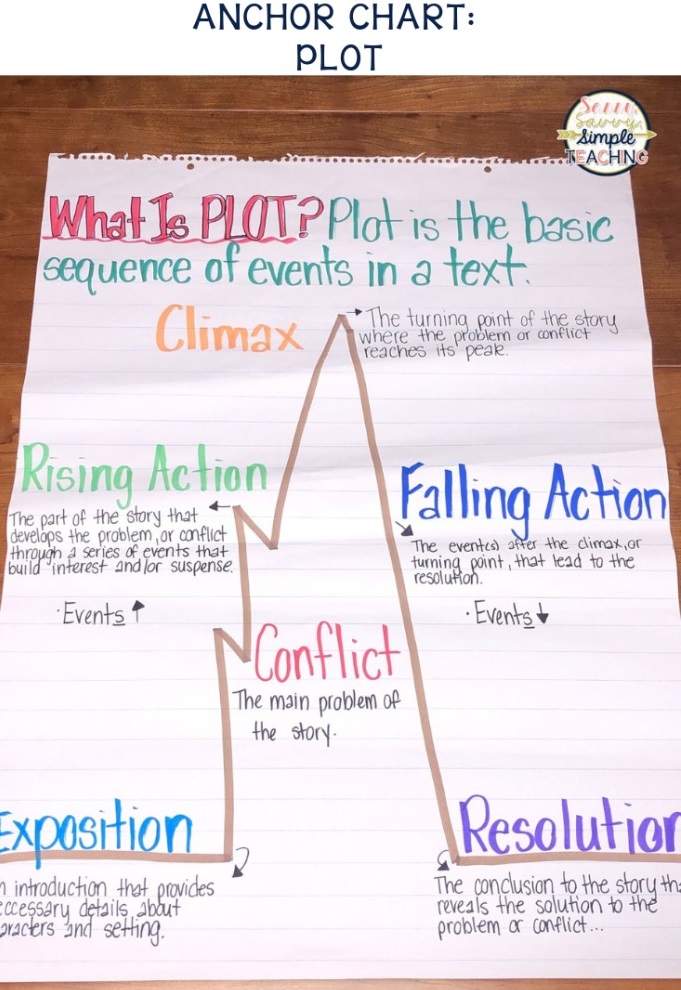
This anchor chart looks at plot as a sequence of events. This is a really great resource because it adds detail to the image of the plot structure by featuring events in the rising action. Color and fonts are used effectively to make the different elements stand out.
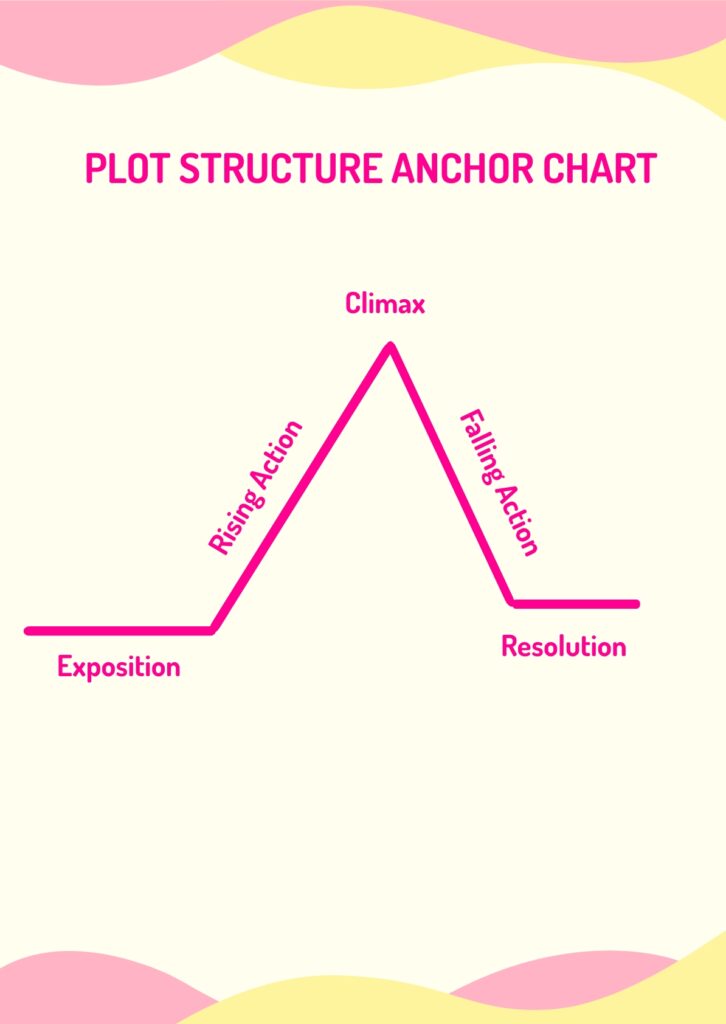
- Plot Structure Anchor Chart From Art Of It
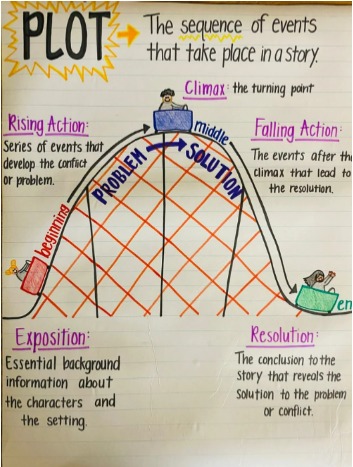
This is a fun anchor chart that looks at how plot is a sequence of events. Using a roller coaster as a graphic for plot is effective, as it gives the image of a story moving along. The colors are deliberately used to make the elements stand out and the explanations are easy to read and understand. This is a resource for older grades.
What happens in the story?
- Plot Anchor Chart From Primary Paradise
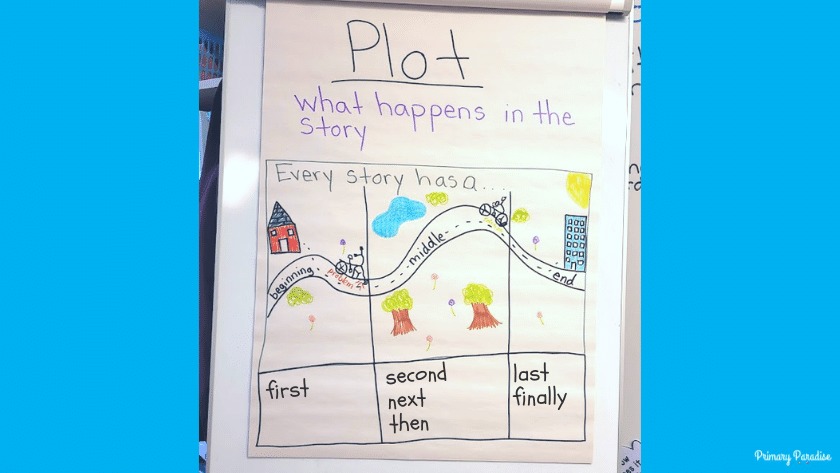
This is just about the perfect idea for an anchor chart on plot for lower grades. The presentation is very simple and in a style that the students can relate to. The inclusion of relevant words is useful.
- Plot Twist From Mandy Eve-Barnett
This anchor chart is only a sign, but has so much potential. If you are looking for the perfect start to an anchor chart about the more interesting elements in a plot, this is the resource to use. It is also best to use it with the upper grades. You can have discussions around how plots can be manipulated and analyze more sophisticated plot structures working from this.
- Anchor Chart Template From Template.net
A blank template for a plot anchor chart is a great beginning. This resource is basically a blank template for a plot anchor chart that you can fill in with your students. You could also give it to them to fill in on their own. It can be used with any grade. However, I suggest using simpler terms for the plot elements with lower grades.
- Narrative Writing From We Are Teachers
This resource looks at Crafting a Plot as part of learning narrative writing. This is such a great resource, with the sense of fun it brings. The ‘usual’ climbing structure of the plot is used in a slightly different way. It is good for lower grades, with the plot elements being described according to what happens.
Final thoughts on plot anchor charts
The structure of any plot includes the five elements of Exposition, Rising action, Climax, Falling action and Resolution. These will be included in any good plot anchor chart. The overall plot structure is usually represented graphically because a plot develops from a ‘low’ point, rising to the climax, which is a ‘high’ point, and falling to an ending. This is the essence of an anchor chart you can use successfully to teach about plots.