3,941 products added recently
Algebra Presentations
Demystify algebra with presentations that break down complex concepts into understandable segments. These resources use visual aids and step-by-step explanations to help students grasp variables, equations, and functions. Use them to enhance comprehension and confidence in algebra.

Math Fact Fluency Mastery Sheets
Math, Addition and Subtraction, Addition, Subtraction, Algebra, Calculus, Decimals, Fractions, Measurements, Multiplication and Division, Grade 1, 2, 3, 4, 5, 6, 7, 8, Worksheets & Printables, Workbooks, Worksheets, Writing Prompts, Word Searches, Teacher Tools, Assessments, Lesson Plans, Graphic Organizers, Presentations
The Math Facts Fluency Mastery Sheets-PRO (Professional Edition) is a complete (53 page) digital PDF resource that includes a variety of structured worksheets, instructional strategies, visual aids, & answer keys to help students build automaticity in addition, subtraction, multiplication, and division. This Professional Edition of the Math Facts Fluency Mastery Sheets were specifically designed to help students practice math fact fluency from basic facts (0-5) to advanced operations (6-12) including, regrouping; fact families; mixed operations; & timed drills. The Math Facts Fluency Mastery Sheets have been specifically designed to provide scaffolded modules that allow students to progress from concrete to abstract materials. Included are: number lines, arrays, part-part-whole diagrams; multiplication tables; and real-world word problems all of which support Elementary Math Standards. Finally, each of the 53 pages includes a baseline assessment; progress monitoring chart; implementation instructions for parents/teachers; and full answer keys to make grading easy. The Math Facts Fluency Mastery Sheets provide an ideal way to provide students with 5-10 minutes daily of deliberate practice for increasing their math fluency, eliminating finger counting, reducing cognitive load while preparing them for multi-digit math, fractions, and algebra. The Math Facts Fluency Mastery Sheets are perfect for use in the classroom, homeschooling; tutoring; & intervention groups in order to increase students' confidence in math and speed through deliberate practice. Why Parents and Schools Appreciate It Tested Method With No Guesswork – The clear mastery pattern, leveled practice exercises, timed benchmarks and answer keys enable teachers and parents to assess children's progress in minutes with absolutely no preparation. Fast Pain-Free Confidence – All kids can go from counting on fingers to having graduated to automatic recall in 5 to 10 minutes a day therefore reducing 'math anxiety' and allowing their brain to be focused on solving word problems or doing advanced maths Multi-Sensory Visual Aids – Abstract mathematics become concrete with the aid of using arrays, number lines, fact family charts, and other concrete models making it easier for visual learners, ESL students/learners, and students in the Special Education Program. Flexible Usage – Used in the classroom, homeschool, tutor (school breaks), summer review etc., has parent implementation ideas along with ability to track data for the benefit of school administration. Professional Quality – 53 pages of printable resources inclusive of strategies to enhance student learning outcomes that will be visible in report cards and standardized tests. Target Audience of the Resource (Based on a Study of the Complete Resource) : A resource that targets students in Grade 1–4 grades. (Most aligned to students in grades 2–3.) Addition Fundamentals (0 to 5) + Advanced Addition (6 to 12) + Addition Basics (0 to 5). Used by kindergarten/first grade students through second grade. Advanced Subtraction (up to four-digit regrouping) + Multiplication Foundations (0 to 5) . Used by second and third grade students. Multiplication Mastery (6 to 12) + Division Basics (1 through to 5) + Division Mastery (6 through to 12) + Mixed Operations Used by students in fourth and fifth grades. Therefore, it can be used to remediate fourth-grade students or to enrich first-grade students, but since this early mastery resource is based on developing fact fluency, it is ideally positioned for students in second or third grades. Copyright/Terms of Use This book was published copyright owned by Syed Hammad Rizvi for personal/single classroom use only; any alteration, redistribution or sale of this resource in any format including digital would constitute an infringement of copyright law. You are welcome to use this resource in your own classroom, but cannot share with another teacher unless you purchase additional rights through Teachsimple. Thank you for honoring these terms of use! Syed Hammad Rizvi is happy to provide this resource.
Author Creative Book Store
Rating
Tags MathFactFluency, MathFluency, ElementaryMath, MathWorksheets, MathMastery, AdditionSubtractionMultiplicationDivision, TimedMathDrills, MathFacts, FactFamilies, MathFactFluencyWorksheets
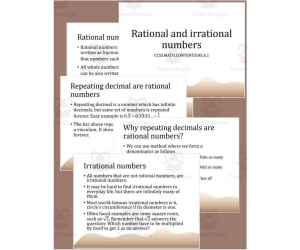
Rational and Irrational Numbers Editable PowerPoint 8.NS.A.1
Math, Algebra, Grade 8, Presentations, Teacher Tools
This PowerPoint explains the difference between rational and irrational numbers. It covers course 8.NS.A.1
Author TheBrightestKid
Tags Rational Numbers, Irrational Numbers, Presentation

Gamified Algebra Adventures - Mathematics
Math, Algebra, Early Math, Basic Operations, Numbers, Patterns, Place Value, Graphing, Measurements, Money, Grade 2, 3, 4, 5, 9, 10, 11, 12, Activities, Games, Projects, Centers, Teacher Tools, Assessments, Charts, Diagrams, Lesson Plans, Presentations
Embark on an adventure in the world of algebra with Gamified Algebra Adventures: Mathematics, an extensive and engaging high school algebra workbook that translates challenging mathematical concepts to adventurous and fun missions. Written by Syed Hammad Rizvi, this 466-page digital textbook for grade 9 to 12 encompasses fundamental concepts of algebra ranging from basic to advanced topics such as: • Variables • Expressions • Equations • Inequalities • Functions • Linear Systems • Polynomials • Factoring • Quadratics • Rational Expressions • Radicals With adventurous names for every chapter like "The Algebraic Quest Begins: Unveiling Variables," "The Great Math Treasure Hunt," and "Navigating the Mathematical Maze," Gamified Algebra Adventures: Mathematics is an engaging math textbook that combines the concepts of algebra with fun adventures that are apt for grade 9 to 12 in math. This textbook has been optimized with SEO keywords that enable viewers to easily access it while giving parents and teachers complete guidance on how to accomplish high school math for teenagers with its gamified algebra lessons that are perfect for making math fun and easy while improving grades in math. Why Parents/Schools Love It: Engaging Gamified Learning Platform: Chapters mapped as ‘adventure quests’ and case studies help transform boring sessions of learning Algebra into thrilling missions, encouraging students and overcoming math phobias. All-Rounded Coverage: This textbook covers 104 chapters with explanations on how to solve algebra problems starting from the basics of variables to the advanced topic of radicals. Applications: These models can include the behavior of the economy, physics, and other fields, where the use of mathematics can be demonstrated in applicatio Flexible and Inexpensive: The digital version is ideal for homeschooling or as a supplement for the classroom as well as for individual self-study with easy-to-understand text. Helps to Build Confidence and Skills: It is designed to emphasize the mastery of problem solving, visual models and representation, and generalization concepts in order to prepare the students for tests and college studies. Target Students : On the basis of an overall analysis of the Table of Contents and some sampled material from different chapters (starting off with basics, for example, variables and expressions in initial chapters, then moving on to more complex subjects in quadratic equations, rational expressions, and radical equations in Latter chapters), it can be said that this particular book has applications for grades 9 to 12, and it fits into an overall curriculum for Algebra I and Algebra II, starting off with basics for those who were beginners (beginning grade 9 or an initial course in algebra, appropriate for those at grades 10 to 12 or those pursuing an advanced course in algebra). Additionally, it can be used by Middle-grade kids switching to High school or by those heading off to college for pre-calculus prep. Copyright/Terms of Use : This Book was copyrighted by Syed Hammad Rizvi. The use of this resource shall be for non-commercial purposes only. You shall not copy and redistribute, or sell any portion of this resource. What this means, among other things, is that you cannot upload it on the Internet so it can be downloaded by anyone on the Internet. In case you need to share this resource with fellow teachers, you can purchase the license from Teachsimple. Thank you for abiding by the conditions. This product is, of course, brought to you by Syed Hammad Rizvi
Author Creative Book Store
Rating
Tags GamifiedAlgebraAdventures, AlgebraWorkbook, HighSchoolMath, GamifiedLearning, MathAdventures, Grades9to12Math, InteractiveAlgebraGuide, AlgebraForTeens, STEMEducationResources, HomeschoolAlgebra
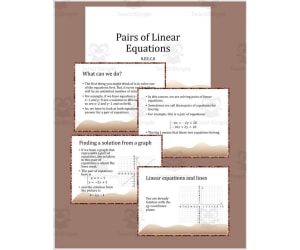
Pairs of Linear Equations Editable PowerPoint 8.EE.C.8
Math, Algebra, Grade 8, Teacher Tools, Presentations
This editable PowerPoint explains pairs of linear equations for 8th grade math students. First, we will explain what a pair of equation is. Next, we have to discover what kind of things we can do in order to get the solution. We will find, that we have to look at both equations at the same time to get a meaningful solution. After that, we present the idea of placing the pair of equations to a coordinate plane. This is straightforward when the pair of equations has x and y as variables, we can use the all familiar xy-coordinate plane. At the first phase we will find the solutions from coordinate planes when the lines are already there. At the next phase, we will look at how to draw the lines from the equations. For that, we will use small tables where we calculate some values for x and y. Then drawing the lines is easy. For 8.EE.C.8.B we explain how to transform te equations first and then solve from graph. (In common core, this is called solving from equations, although the common core doesn't actually require students to solve the pair of equations algebraically.) We also point out some special cases, where there is no solution. In section 8.EE.C.8.C there are some real-world problems. We will go through some examples where we create a pair of equations from a verbal problem. There is also an extra sections about actually solving pairs of linear equations algebraically, this is good to know information for many students although the common core doesn't require it. There is 46 slides in this PowerPoint.
Author TheBrightestKid
Tags Pair Of Equations, Pairs Of Linear Equations, Graphical Solution
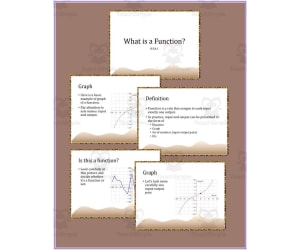
What is a Function Editable PowerPoint 8.F.A.1
Math, Algebra, Grade 8, Presentations, Teacher Tools
This PowerPoint explains what is a function (and what is not a function). There are continuous graphs, discrete graphs and tables and we focus on the fact that in order to be a function, there have to be only one output for each input.
Author TheBrightestKid
Tags Function, Function Definition, Algebra, Graphing A Function
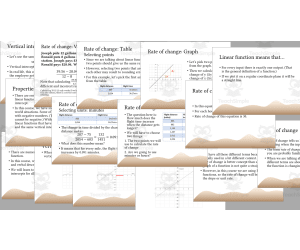
Compare Linear Functions PowerPoint for 8th Grade Math Course 8.F.A.2
Math, Algebra, Grade 8, Presentations, Teacher Tools
This editable PowerPoint covers requirements of the common core math course 8.F.A.2. Contents: Meaning of linear function: For every input there is exactly one output and the graph is a straight line Properties of linear functions: Two properties define linear function; rate of change and vertical intercept Rate of change: recalling different terms that may be familiar for students Vertical intercept: Where the graph meets the vertical axis, also know as the y-intercept Different ways of representing a function: In this course, we will use equations, graphs, tables and verbal descriptions. Rate of change: Equation Finding rate of change from an equation Rate of change: Graph Finding rate of change from a graph using change of y (delta y) and change of x (delta x) Rate of change: Table The example is about flight distance in miles and flight time. This example is a bit more challenging than the other ones. Rate of change: Verbal description There is a real-life example about gasoline prices. Vertical intercept: Equation Finding vertical intercept from an equation Vertical intercept: Graph A simple example about finding y-intercept from a graph in xy-coordinate plane. Vertical intercept: Table Two examples, of which the first one is easy and the second one requires some calculating. Vertical intercept: Verbal description In this example, we use the same gasoline price example than earlier, and find out, that there is a $5 service cost in this station (vertical intercept). Summary: Rate of change To get the rate of change, we usually need two samples. Then we calculate difference of outputs and divide it by difference of inputs. Summary: Vertical intercept Summarizing how we find vertical intercepts in different situations. There are 26 slides in this presentation . For more 8th grade math PowerPoints and worksheets, see my Teach Simple page at: https://teachsimple.com/contributor/thebrightestkid
Author TheBrightestKid
Tags Functions, Rate Of Change, Vertical Intercept, Y-intercept, Comparing Functions, Properties Of Linear Functions, Linear Functions, Compare Linear Functions
Quadratic Equations and Cubic Equations Editable PowerPoint for 8th Grade 8.EE.A.2
Math, Algebra, Grade 8, Presentations, Teacher Tools
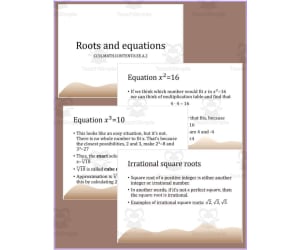
This PowerPoint explains how to solve quadratic and cubic equations at 8th grade level. 8.EE .A.2.
Author TheBrightestKid
Tags Quadratic Equations, Cubic Equations, Roots
Powers Integer Exponents Editable PowerPoint 8.EE.A.1
Math, Algebra, Grade 8, Presentations, Teacher Tools
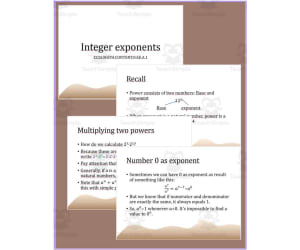
This PowerPoint explains the calculation rules of integer exponents including zero and negative exponent. This presentation covers course 8.EE .A.1.
Author TheBrightestKid
Tags Powers, Exponents, Integer Exponents, Presentation, How To Write Exponents In Powerpoint, Negative Exponents Powerpoint, Powerpoint Exponents, 8.ee.a.1, How To Make Exponents In Powerpoint
Working with Scientific Notation Editable PowerPoint 8.EE.A.4
Math, Algebra, Grade 8, Presentations, Teacher Tools
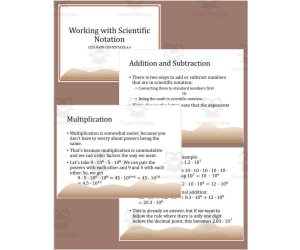
This presentation explains how to use scientific notation in calculations. 8.EE .A.4 Common metric prefixes are also listed in this PowerPoint.
Author TheBrightestKid
Tags Scientific Notation, Operations With Scientific Notation, Metric Prefixes

Proportional Relationship Editable PowerPoint 8.EE.B.5
Math, Algebra, Grade 8, Presentations, Teacher Tools
This PowerPoint explains the basics of proportional relationship and unit rate to 8th grade math students. This presentation covers course 8.EE .B.5.
Author TheBrightestKid
Tags Proportional Relationship, Constant Of Proportionality, Graphing From Equation, Unit Rate, 8.ee.b.5, 8 Ee 5
Constructing Functions Editable PowerPoint for 8th Grade 8.F.B.4
Math, Algebra, Grade 8, Teacher Tools, Presentations
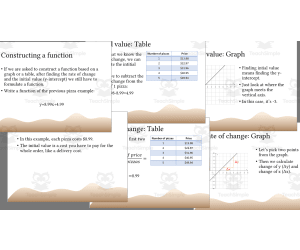
This PowerPoint presentation for 8th grade math covers common core course 8.F.B.4. The focus is constructing linear functions from graphs or tables. There are no brand new concepts compared to previous courses, except the term initial value.There are 11 slides in this presentation . We will find rates of change and initial values (y-intercepts) from graphs and tables with simple examples. This PowerPoint is editable, except the pictures. Contents: Recalling that equation of a linear function is of a form y=mx+b (with xy-coordinate plane) To construct functions, we need to find the right values for m and b Example of picking two points from the graph and calculating the change of y and the change of x. Then we calculate the rate of change by division. Example of finding an initial value from a graph Example of finding rate of change from a table that describes price of pizzas Continuing the pizza example, finding the initial value from a table Meaning of the initial value in this example, for example a delivery cost Constructing the equation from the pizza example This presentation is part of my series for 8th grade math. You can find more PowerPoints and worksheets from my Teach Simple page: https://teachsimple.com/contributor/thebrightestkid
Author TheBrightestKid
Tags Functions, PowerPoint, Constructing Functions, Y=mx+b, Editable, Algebra, Presentation
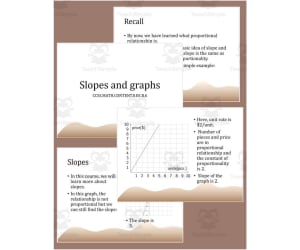
Slopes and Graphs Editable PowerPoint 8.EE.B.6
Math, Algebra, Grade 8, Presentations, Teacher Tools
Slopes and Graphs Editable PowerPoint 8.EE.B.6 PowerPoint Description: Slopes and Graphs Editable PowerPoint 8.EE.B.6 is a comprehensive, in-depth educational supplement for algebra teachers teaching grade 8 pupils. Displaying information on 33 slides, it elaborates the connections between slope, unit rate, parallel lines and constant of proportionality. It provides a thorough learning experience by explaining complex terms and showcasing their applications. This tool makes optimal use of parallel lines along with similar triangles to indicate that the slope remains constant irrespective of selected points. Note: This resource can be customized to suit different classroom settings since it's presented in an editable Microsoft PowerPoint format. Instructions can be given during full-class discussions or smaller groups for problem-solving exercises. User versatility: Homeschoolers will find this module helpful whether used independently or as additional material enhancing fundamental algebraic principles. Pupils may use the PPT as homework – providing them further opportunities to assess each concept at a pace comfortable for them – improving understanding over time. Slopes and Graphs Editable PowerPoint 8.EE.B.6: Key Benefits: Liberates educators from exhaustive lesson planning while ensuring academic honesty necessary for advanced math learners developing foundational skills significant for future studies. An engaging tool transitioning student understanding from theory protocols into realistic applications effortlessly integrating proven instructional methods with modern technology features.
Author TheBrightestKid
Tags Slope, Unit Rate, Constant Of Proportionality, Parallel Lines, Similar Triangles
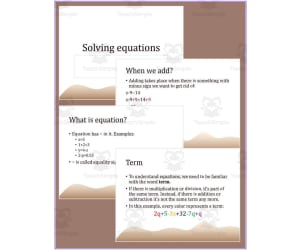
Solving Linear Equations Editable PowerPoint
Math, Algebra, Grade 8, Presentations, Teacher Tools
This editable PowerPoints explains how to solve linear equations. 8th grade level ( 8.EE .C.7.B
Author TheBrightestKid
Tags Equations, Solving Equations, Linear Equations, Solving Linear Equations, Algebra
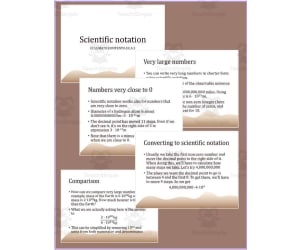
Scientific Notation PowerPoint 8.EE.A.3
Math, Algebra, Grade 8, Presentations, Teacher Tools
This presentation explains the basics of scientific notation, course 8.EE .A.3
Author TheBrightestKid
Tags Scientific Notation, Powers Of Ten, Very Large Numbers, 8th Grade Science Powerpoint
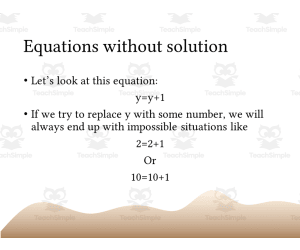
How many solutions to an Equation Editable PowerPoint
Math, Algebra, Grade 8, Presentations, Teacher Tools
This PowerPoint presents equations without solutions and equations with infinite number of solutions. Course 8.EE .C.7.A
Author TheBrightestKid
Tags Equations, Solutions, No Solutions, Infinite Number Of Solutions