Penny Spinners STEAM Activity


- Grades
- Grades 2–4, Elementary
- File type
- Preparation
- Print ready


- Subject
- Science, Engineering, STEM, Math, Statistics, Graphing
- Topic
- science, penny spinners
- Resource types
- Activities
- Preparation
- Print ready
About this resource
What's inside this resource
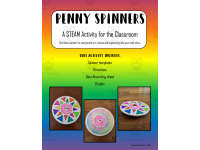
This Penny Spinners STEAM Activity will allow you to incorporate art, science and engineering into your math classroom.
This activity includes:
- Spinner templates
- Directions
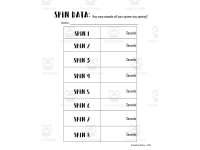
- Data Recording sheet
- Graphs
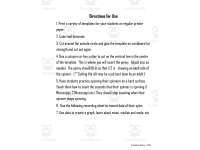
Directions are included for creating spinners.
Students will create their spinners and begin collecting data!
Related resources
More resources teachers may find useful
24 related resources were found using this product's title, contributor, categories and tags.




In the classroom
Teaching tips & learning objectives

Learning objectives
Construct a simple spinning top using a paper template, cardboard backing, and a penny as a weighted axle
Measure and record elapsed time in seconds across multiple trials
Represent a personal data set using both a bar graph and a color-coded pie graph

Teaching tips
Have an adult cut the center slit for younger students, as the directions specifically flag this step as best done by an adult
Print several spinner template variations so students can compare how different designs affect spin time
Use the completed pie graph as a natural lead-in to discussing color-coded data ranges before the mean/median/mode lesson

Skills covered
Engineering design and build — students assemble a working penny-spinner top from a flat template using specified construction steps.
Time measurement — students count seconds while their spinner is in motion across eight trials.
Data graphing — students represent their own spin-time data on both a bar graph and a color-coded pie graph.
Good to know
Questions teachers ask about this resource
Why does the activity ask students to color-code their pie graph using time ranges rather than exact seconds?
The pie graph key groups spin times into six-second bands (0-5, 6-10, 11-15, and so on up to 25+), so each slice represents a range rather than one exact value, making the graph easier to build from a small set of trial results.

No reviews yet
Downloaded this resource? Tell other teachers how it went.
Resource details
Concepts & topics
Core concepts
 Core concepts
STEAM/engineering design
data collection
graphing
mean median mode
 Topics
More to explore
You may also like