Ice Cream Graph Activity
- Grades
- Grades 2–4
- Pages
- 5
- File type
- Preparation
- Print ready


- Subject
- Math, Graphing
- Topic
- Pictograph, Class Survey
- Resource types
- Activities
- Preparation
- Print ready
- Standards
- 3.MD.B.3
Product description
From the author
If you are looking for exciting and impactful ways to have students practice with organizing data and graphing, look no more!
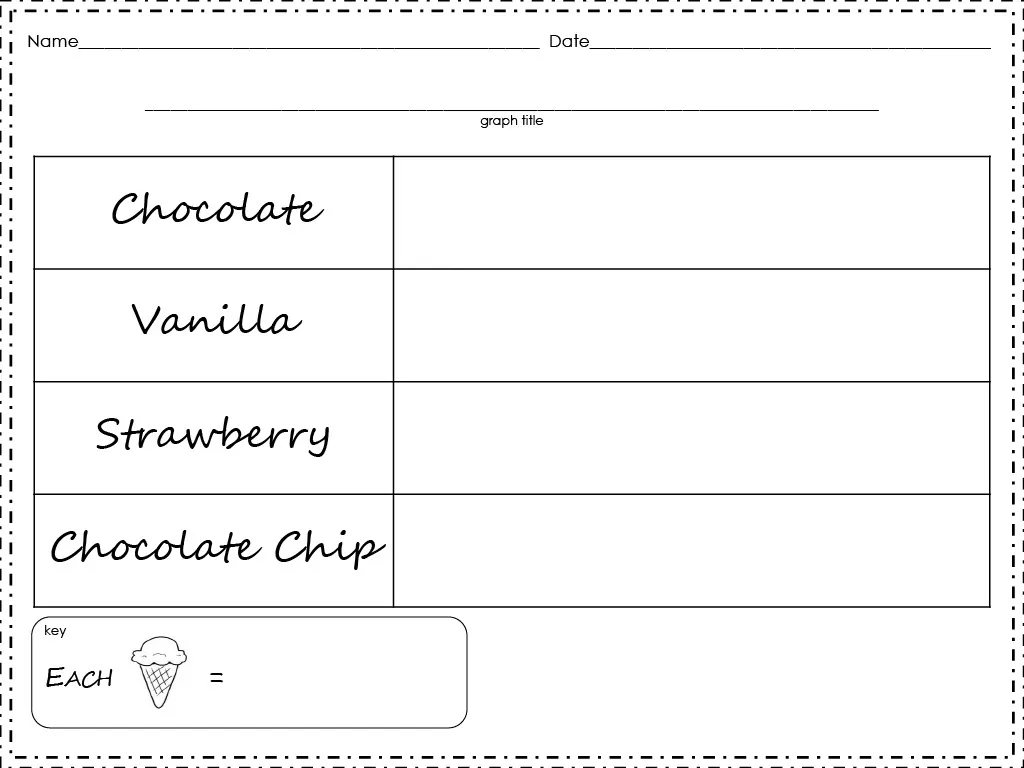
This is an Ice Cream Graph Activity for your students to take part in.
It may be used best with 2nd – 5th grade math students.
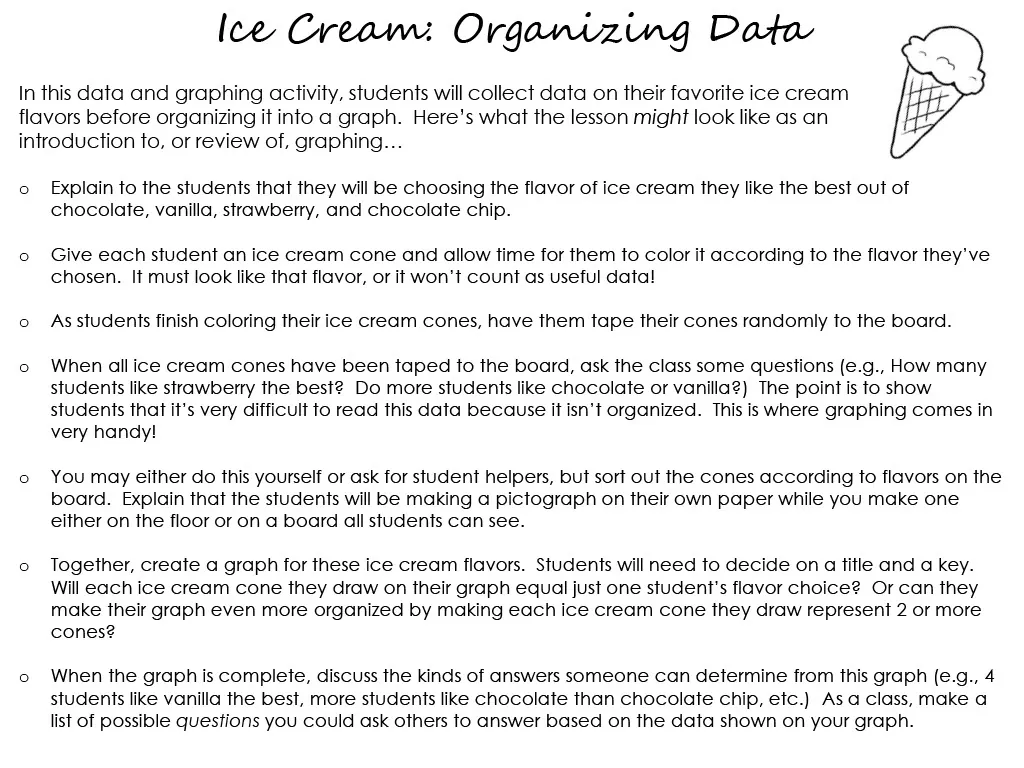
In this data and graphing activity, students will collect data on their favorite ice cream flavors before organizing it into a graph. Here’s what the lesson might look like as an introduction to, or review of, graphing…
o Explain to the students that they will be choosing the flavor of ice cream they like the best out of chocolate, vanilla, strawberry, and chocolate chip.
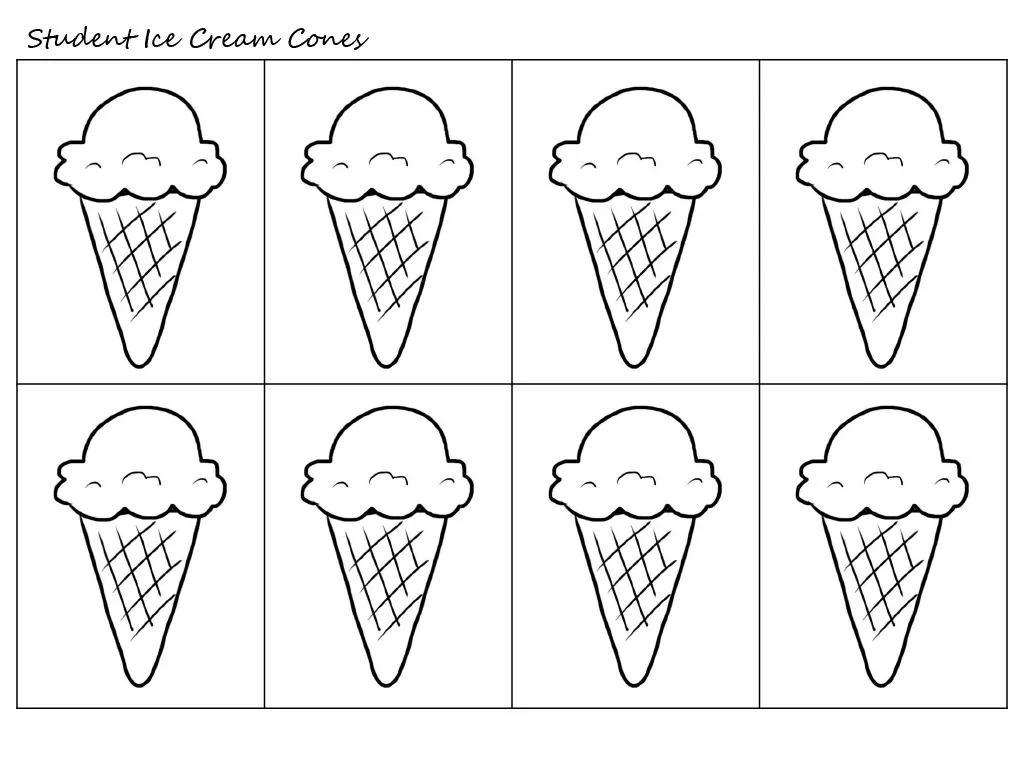
o Give each student an ice cream cone and allow time for them to color it according to the flavor they’ve chosen. It must look like that flavor, or it won’t count as useful data!
o As students finish coloring their ice cream cones, have them tape their cones randomly to the board.
o When all ice cream cones have been taped to the board, ask the class some questions. The point is to show students that it’s very difficult to read this data because it isn’t organized. This is where graphing comes in very handy!
o You may either do this yourself or ask for student helpers but sort out the cones according to flavors on the board. Explain that the students will be making a pictograph on their own paper while you make one either on the floor or on a board all students can see.
o Together, create a graph for these ice cream flavors. Students will need to decide on a title and a key.
o When the graph is complete, discuss the kinds of answers someone can determine from this graph (e.g., 4 students like vanilla the best, more students like chocolate than chocolate chip, etc.) As a class, make a list of possible questions you could ask others to answer based on the data shown on your graph.
I hope you enjoy!
Here are links to similar resources in my store:
I can be contacted for questions and concerns at sallyplant12@hotmail.com.
Related resources
More resources teachers may find useful
24 related resources were found using this product's title, contributor, categories and tags.


In the classroom
Teaching tips & learning objectives

Learning objectives
Collect categorical data by choosing and representing a personal preference (favorite ice cream flavor)
Organize unsorted data into a pictograph with a title and key
Formulate and answer questions based on data displayed in a graph

Teaching tips
Have students tape their colored cones to the board in random order first, so they experience firsthand why unorganized data is hard to read before sorting it
Model 1-2 sample questions about the completed class graph before students write their own 5 questions, since the worksheet's question format is open-ended
Use this as an introduction to pictographs and keys, or as a review activity for students who have already been introduced to graphing

Skills covered
Data collection — students generate categorical data by choosing and representing their own favorite ice cream flavor.
Data organization — students sort disorganized data by category and build a pictograph with a title and key.
Question formulation — students write and answer their own questions based on the data shown in their completed graph.

No reviews yet
Downloaded this resource? Tell other teachers how it went.
Curriculum
Standards, concepts & topics
Standards
 Standards
- 3.MD.B.3
Core concepts
 Core concepts
Pictographs
Data organization
Graph titles and keys
Topics
 Topics
Explore more
Categories this resource belongs to
Explore related searches
More to explore
You may also like