Statistics & Probability Real-World



Math, Algebra, Addition and Subtraction, Addition, Subtraction, Statistics, Order Of Operations, Measurements, Fractions, Early Math
Worksheets & Printables, Workbooks, Worksheets, Word Searches, Teacher Tools, Assessments, Lesson Plans, Quizzes and Tests, Quizzes, Tests


About This Product
Transform how your students understand data, chance, and media claims with the ultimate Statistics & Probability Real-World Complete Unit & Student Workbook!
Are your students tired of memorizing abstract math formulas without knowing how they apply to real life? This comprehensive, 56-page no-prep resource bridges the gap between textbook mathematics and authentic, real-world decision-making. Designed for Middle and High School Math (Grades 6–12), this modular curriculum takes students step-by-step from foundational data collection to advanced statistical reasoning.
Whether you are teaching High School Statistics, Algebra I & II, Financial Literacy, Pre-Algebra, or Quantitative Reasoning, this all-in-one bundle provides crystal-clear textbook-style readings, real-world case studies, 9 scaffolded practice worksheets (90 total problems!), visual anchor charts, a pacing guide, and a complete step-by-step teacher answer key.
WHAT’S INCLUDED IN THIS 56-PAGE RESOURCE:
PART 1: Comprehensive Instructional Text & Real-World Case Studies (Pages 1–19)
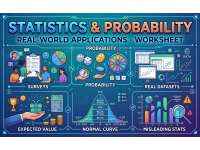
Chapter 1: Surveys & Sampling – Populations vs. samples, selection bias, response bias, non-response bias, Simple Random Sampling (SRS), Stratified, Cluster, and Convenience sampling, plus a Local Community Survey Case Study.
Chapter 2: Probability & Expected Value – Sample spaces, basic & compound probability (independent vs. dependent events), Expected Value (EVEV) formula, tech startup investment analysis, and a Charity Raffle Financial Case Study.
Chapter 3: The Normal Curve & Real Datasets – Mean, median, mode, range, standard deviation (σσ), properties of the Bell Curve, the 68–95–99.7 Empirical Rule, real dataset analysis (50 student heights), and a 20-Year Monthly Rainfall Case Study.
Chapter 4: Misleading Statistics & Critical Thinking – Truncated Y-axes, inconsistent X-axis intervals, cherry-picking data, mean vs. median salary distortions, correlation vs. causation, confounding variables, and Deconstructing a Political Advertisement.
PART 2: 9 Scaffolded Student Worksheets + Formula Reference Guide (Pages 20–40)
Includes a Student Progress Tracker, Quick-Reference Formula Sheet, and 90 applied problems:
Worksheet 1: Crafting Effective Surveys for Insight (Sampling & Bias)
Worksheet 2: Interpreting & Representing Real-World Survey Data (Tables, Graphs, Central Tendency)
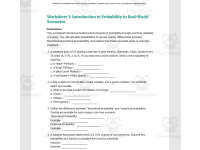
Worksheet 3: Introduction to Probability in Real-World Scenarios (Theoretical vs. Empirical)
Worksheet 4: Compound & Conditional Probability Challenges (Addition Rule, Dependent Events, Bayes' Theorem)
Worksheet 5: Understanding Expected Value: Decisions & Risks (Games, Raffles & Insurance)
Worksheet 6: Expected Value in Games and Investments (Venture Capital, R&D, Lotteries & Utility)
Worksheet 7: Unpacking the Normal Curve: From Heights to Test Scores (Bell Curve & Empirical Rule)
Worksheet 8: Applying the Normal Curve: Percentiles and Z-Scores (Standardizing Data)
Worksheet 9: Identifying Misleading Statistics & Data Visualizations (Media & Data Literacy)
PART 3: Visual Anchor Charts, Teacher Pacing Guide & Full Answer Key (Pages 41–56)
4 Printable Visual Anchor Charts & Reference Matrices: Perfect for interactive math notebooks, classroom posters, or exam study guides!
Teacher Implementation & Pacing Guide: Modular 2-to-4-week unit plan broken into 5 easy-to-teach modules with differentiation notes and hands-on project ideas.
Comprehensive Step-by-Step Answer Key: Detailed mathematical setups, formulas, and explanations for all 90 worksheet questions.
CURRICULUM & STANDARDS ALIGNMENT:
Common Core State Standards (CCSS): 6.SP, 7.SP, 8.SP, HSS-ID (Interpreting Categorical & Quantitative Data), HSS-IC (Making Inferences & Justifying Conclusions), HSS-CP (Conditional Probability), HSS-MD (Using Probability to Make Decisions).
Ideal For: Classroom Instruction, Homeschool Curriculums, AP Statistics Prep, Financial Literacy Units, Emergency Sub Plans, Independent Work Packets, and Exam Review.
Keywords: Statistics and Probability Unit, Normal Distribution Worksheet, Empirical Rule 68-95-99.7, Z-Scores Practice, Expected Value Financial Literacy, Misleading Graphs and Statistics, Sampling and Bias, Compound and Conditional Probability, High School Math Anchor Charts, Real World Data Analysis.
Why Educators and Caregivers Choose This Resource :
100% No-Prep & Self-Contained Curriculum: Combines textbook-quality instructional chapters, real-world case studies, 90 practice problems, visual anchor charts, and a step-by-step answer key in one print-and-go PDF—saving teachers and homeschool parents hours of prep time.
Builds Real-World Financial & Media Literacy: Goes beyond rote formula memorization by teaching students how insurance, raffles, investments, opinion polls, and deceptive advertisements actually work in everyday life.
Built-In Differentiation for Grades 6–12: Modular design allows middle schoolers to master foundational data literacy, surveys, and basic probability while challenging high schoolers with Z-scores, standard deviation, expected value, and conditional probability.
Visual Learning & Reference Support: Includes 4 high-impact visual flowcharts, a bell curve diagram, and a formula cheat sheet that fit seamlessly into interactive math notebooks or classroom bulletin boards.
Detailed, Step-by-Step Answer Key: Every calculation and open-ended critical thinking question includes the exact formula setup and reasoning, making grading effortless and independent self-checking easy for students.
Designed For :
Primary Target (Best Fit): Grades 8–12 (High School)
Why: The curriculum covers Standard Deviation (σσ), Z-Scores, Percentiles, the 68–95–99.7 Empirical Rule, Expected Value (ΣΣ), Conditional Probability P(A∣B)P(A∣B), Bayes' Theorem, and Utility Functions/Risk Aversion. These are core standards for High School math.
Specific Courses to Tag on TpT & Online Platforms:
High School Statistics & Probability (Grades 9–12)
Algebra II (Grades 10–11 — Normal Distribution, Z-Scores, and Probability are major Algebra II units)
Financial Literacy / Consumer Math (Grades 9–12 — Expected Value, Insurance, Raffles, Startup Investments, and Misleading Ads)
Quantitative Reasoning / Math in Society (Grades 11–12)
AP Statistics Prep / Honors Geometry (Grades 9–12)
Secondary Target (Differentiation): Grades 6–8 (Middle School Accelerated Math / Pre-Algebra)
Why: Chapters 1 & 4 and Worksheets 1, 2, 3, and 9 (Surveys, Sampling Bias, Basic Probability, Mean/Median/Mode, and Misleading Graphs) align directly with 6th, 7th, and 8th-grade Common Core Data & Statistics standards.
Terms of Use & Copyright Notice
© Miss Iffat Rizvi. All rights reserved.
Thank you for purchasing this educational resource. This product is protected by copyright law and is intended solely for personal and individual classroom use.
By downloading this resource, you agree to the following terms:
Permitted Use: You may use these materials with your own students.
Restrictions: You may not modify, redistribute, resell, or share any part of this document.
Digital Sharing: Posting this resource on the internet, public websites, or shared school drives where it can be publicly accessed or downloaded is strictly prohibited.
Sharing with Colleagues
If your coworkers or department peers would like to use this resource, please purchase additional multi-user licenses through Teachsimple. Thank you for respecting the time, effort, and intellectual property that went into creating this product.
Resource Tags
0 Reviews
Check out these other great products