


Using a Pictograph to Represent Data Worksheet – 3rd Grade Graphing






About This Product
Build strong graphing skills with the Using a Pictograph to Represent Data Worksheet. This third grade math printable keeps the focus on one skill so students can practice it with confidence.
Learning objective: Students will review graphing, practice it in context, and show what they know in a way that is easy for the teacher to check.
Why it works: Students stay on task because the directions are short and the practice is the right size for one sitting. Teachers save time because the page is ready to print and easy to check.
What's included:
1 printable worksheet page
Clear, student-friendly directions
2 practice sections (Part A to Part B)
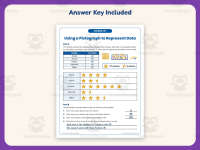
Answer key (1 page)
Cover page
How it's organized: The page opens with these directions: "Use the graph you just made to help you answer each question." The practice is split into 2 parts, so students can work through it in clear steps.
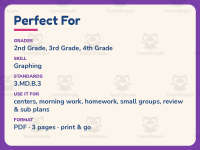
Grade level: Designed for third grade students. It also works well for second grade and fourth grade students who need extra practice or a fresh review.
How to use it: Use it for whole-group practice, small-group instruction, independent work, centers, morning work, homework, or an emergency sub plan.
Answer key: An answer key is included, so you can check work quickly or let students self-correct.
Teaching tips and variations:
Keep a few copies in your early finisher bin for independent review.
Send it home as homework so families can see what their child is learning in math.
Use it as an exit ticket the day after a graphing lesson to see who needs more support.
Skills covered: Graphing, Math
Standards: Supports Common Core 3. MD.B.3.
File type: PDF, ready to print.
Number of pages: 3 (1 worksheet page, 1 answer key page, 1 cover page).
Looking for more graphing practice? Visit the Have Fun Teaching shop for related worksheets, reading passages, and activities for third grade. Have Fun Teaching on Teach Simple
Resource Tags
0 Reviews
Check out these other great products


