Christmas Data & Graphing: Survey the Season, Grades 2-4


About This Product
Count it, tally it, graph it! This 60-page Christmas data and graphing pack for grades 2-4 turns holiday excitement into real math practice. Students learn to read and build tally charts, pictographs, bar graphs, and line plots, then use those skills on six Christmas surveys with ready-made data: favorite gift, favorite cookie, favorite decoration, favorite Christmas song, favorite winter drink, and favorite Christmas character. Each survey gives a tally chart with matching numbers, questions about the most popular and least popular choices, totals, and differences, plus a pictograph or bar graph page for students to build themselves by coloring bars or drawing pictures to match the table.
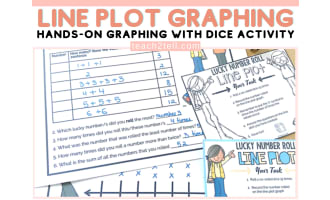
The pack opens with clear how-to pages for each graph type, each with a worked example, so students can start with no prior graphing experience. After the surveys, new data sets stretch their skills further: a line plot about candy canes eaten, a pictograph challenge about cookies baked where each picture stands for two cookies, a bar graph challenge about letters to Santa, and a line plot about days of snow. Data question challenges and two-step problems mix addition and subtraction, while graph detective true-or-false pages ask students to check statements against a graph they built. A comparing-graphs activity splits the gift survey into girls and boys results, and review pages revisit every graph type.
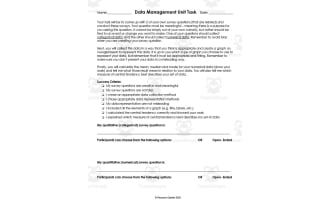
Students finish by planning, running, and graphing a survey of their own, tracking their progress on a graphing star tracker, and earning a Christmas Data Star certificate. Teacher-only answer keys cover every page, so grading is quick and students can check their work. Print and go, with no preparation needed, for math centers, morning work, small groups, or holiday review.
Resource Tags
0 Reviews
Check out these other great products