



Exponential Function Characteristics Worksheet
- Grades
- High School
- File type
- Answer key
- Included


- Subject
- Math, Algebra
- Topic
- Exponential graphs, Domain and range
- Resource types
- Worksheets
- Answer key
- Included
- Standards
- HSF-IF.B.4
Product description
From the author
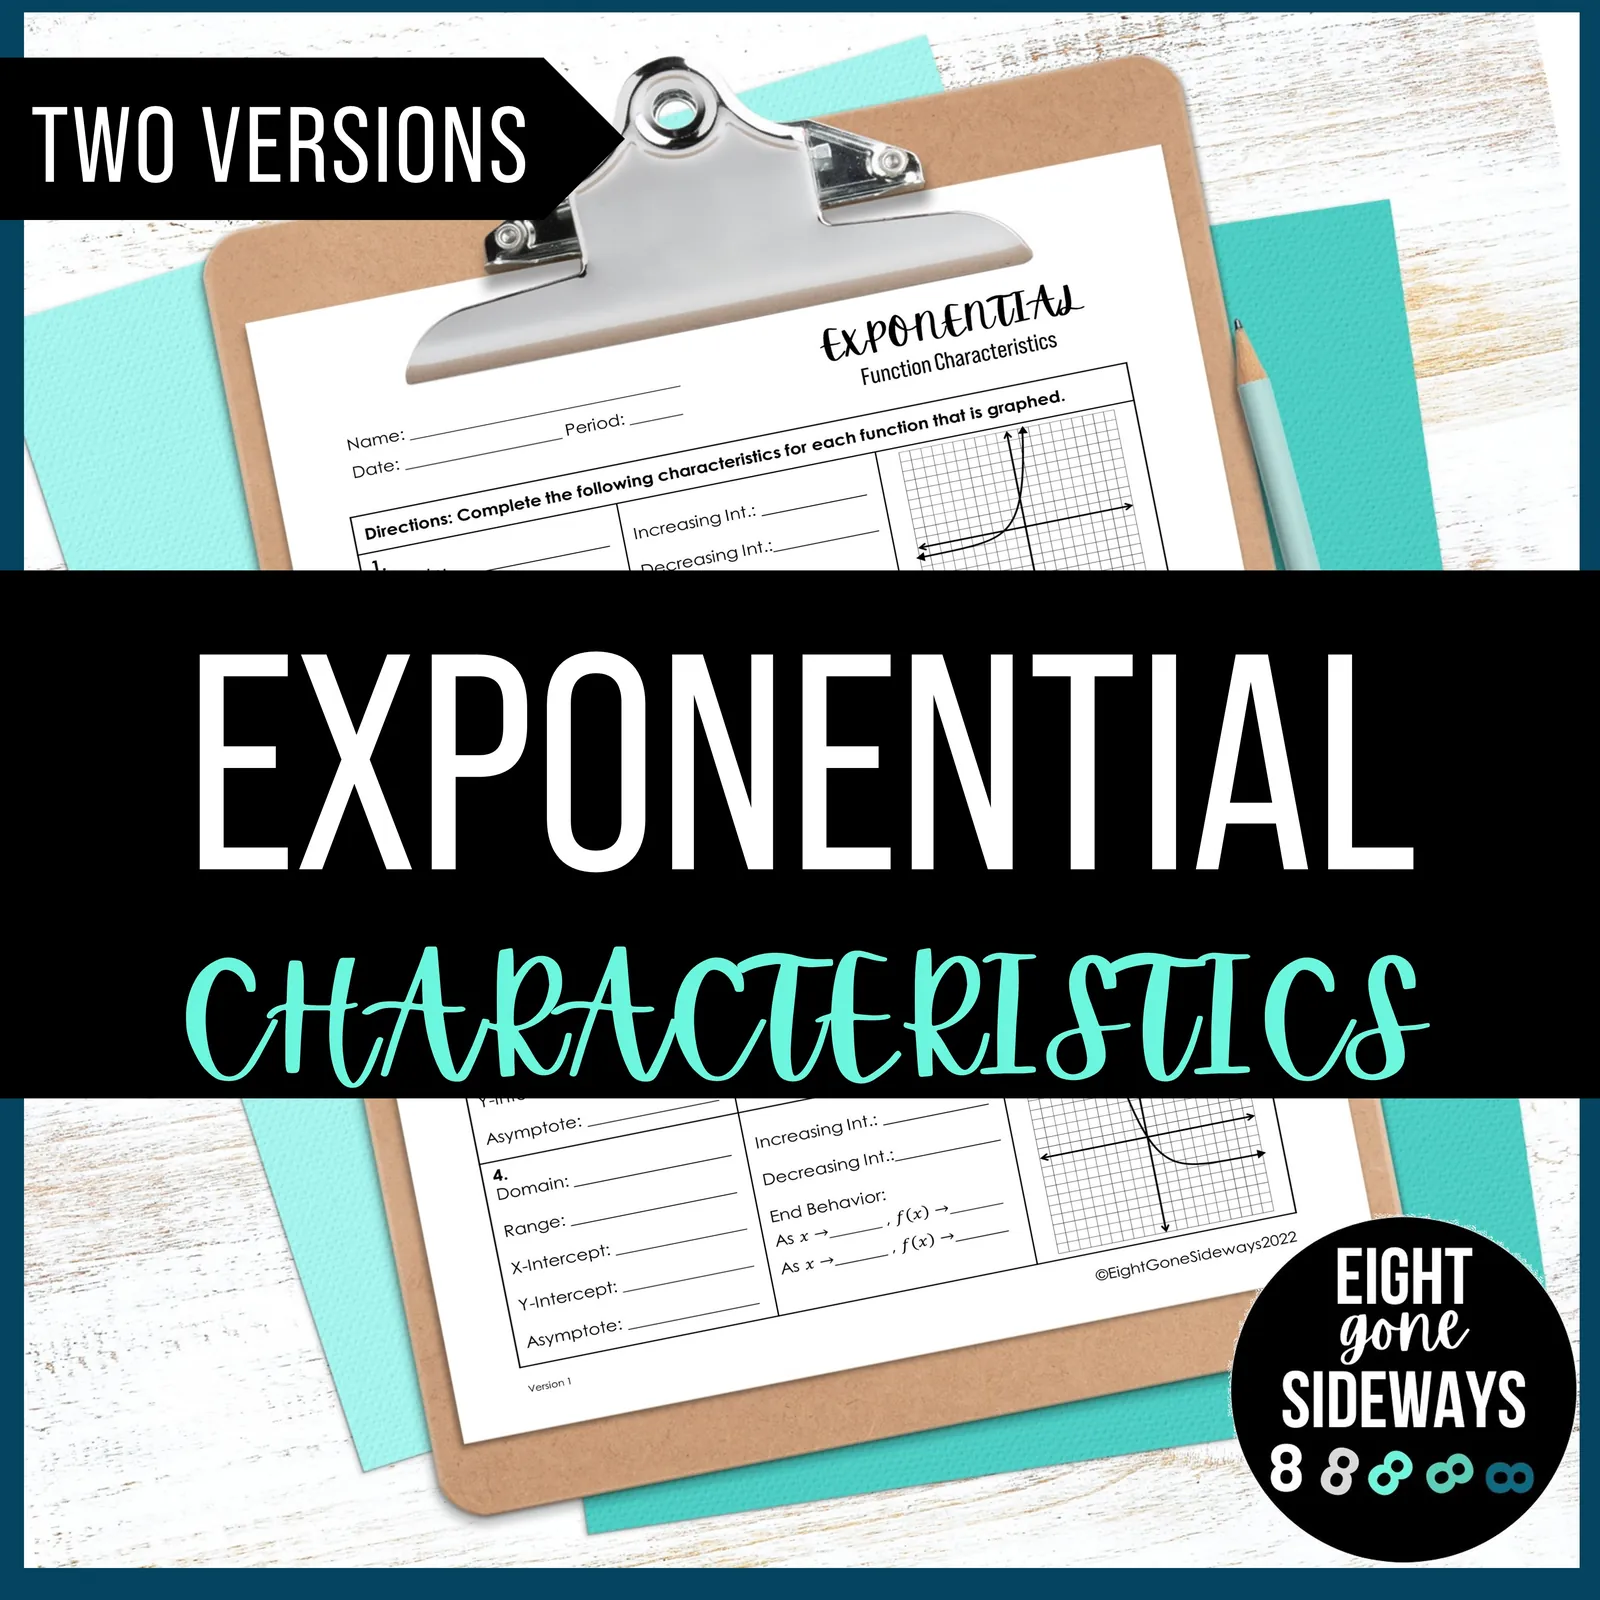
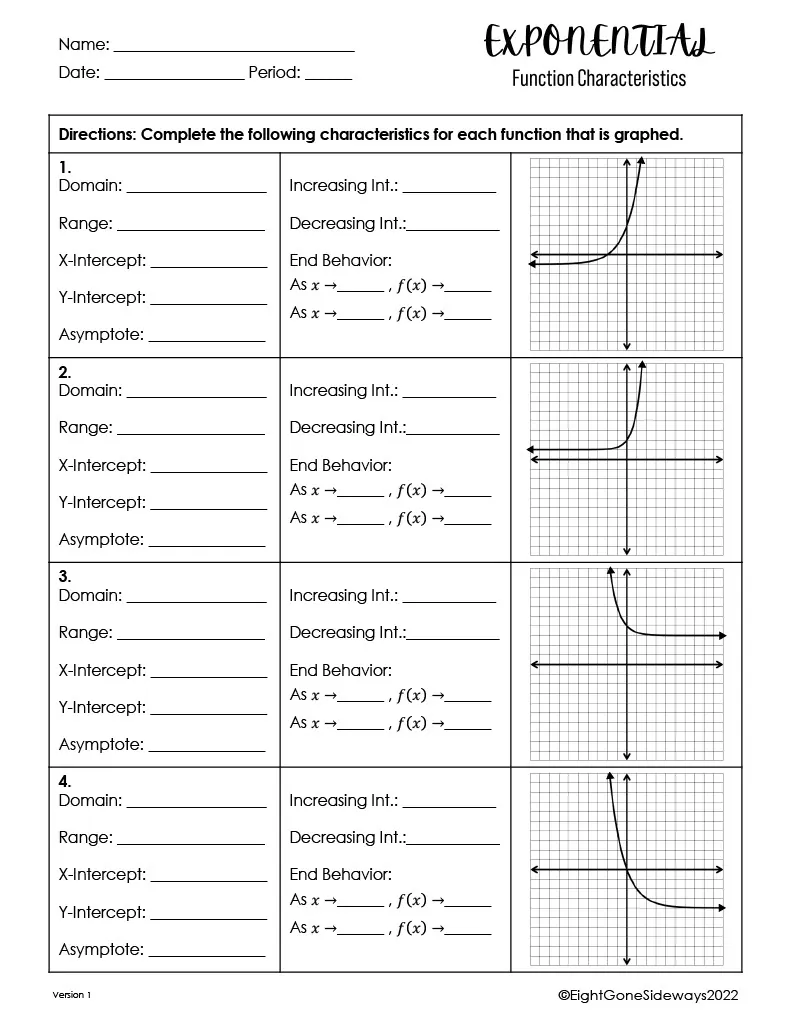
This is an Exponential Characteristics Worksheet that will give students practice with finding characteristics.
Two versions are included. There are 8 problems on each version.
Students will complete the characteristics for each function that is graphed.
Related resources
More resources teachers may find useful
24 related resources were found using this product's title, contributor, categories and tags.



In the classroom
Teaching tips & learning objectives

Learning objectives
Students identify the domain and range of an exponential function from its graph or equation.
Students determine the x- and y-intercepts of an exponential function.
Students describe end behavior of an exponential function using limit notation as x approaches positive and negative infinity.

Teaching tips
Use Version 1 for initial instruction and practice, then assign Version 2 as a retake or parallel second-period assignment, since both versions test the same skill set with different functions.
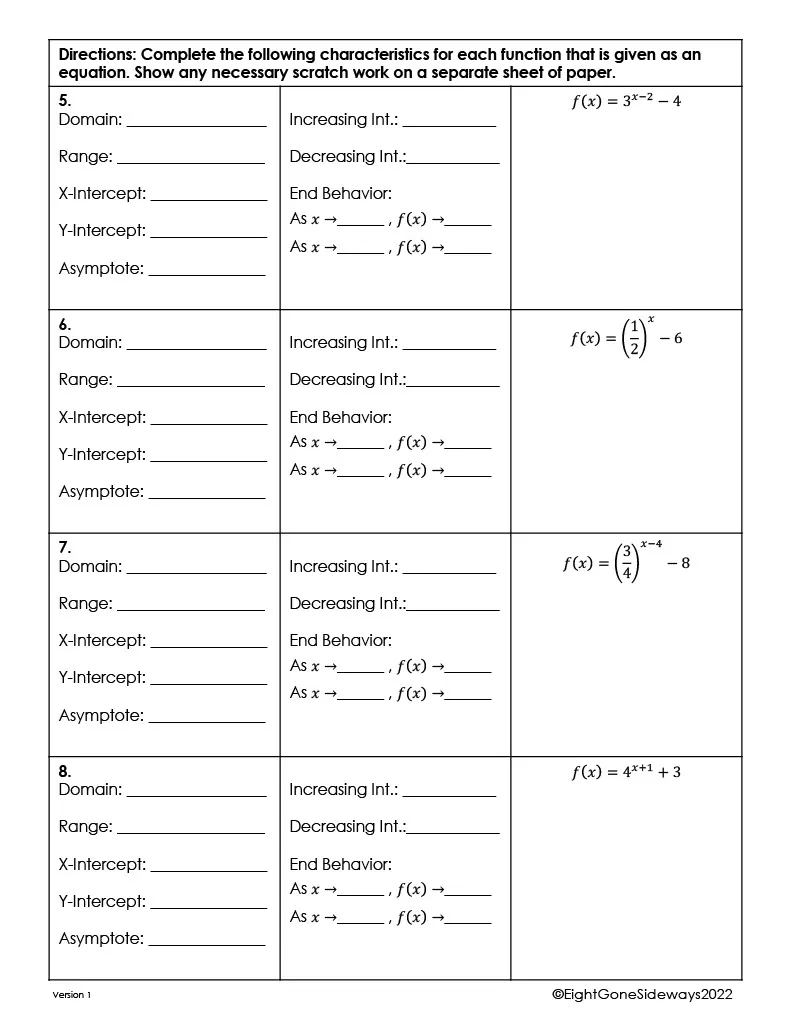
Have students show scratch work for the equation-based functions (items 5-8) on separate paper, as the worksheet's own directions specify.
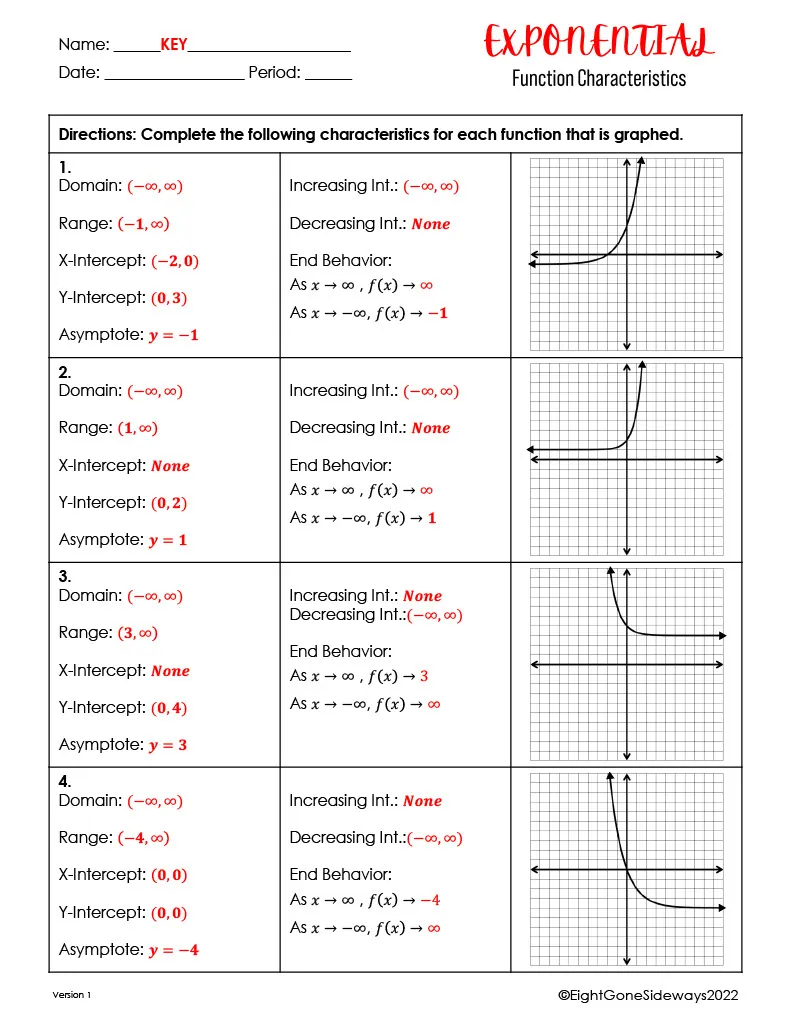
Use the KEY pages' interval and limit notation as a model, since students often write asymptote and end-behavior answers inconsistently.

Skills covered
Domain and range identification — students state the domain and range of exponential functions given as graphs or equations.
Intercept-finding — students calculate x- and y-intercepts for exponential equations such as f(x) = 3^(x-2) - 4.
Asymptote identification — students identify the horizontal asymptote (e.g. y = -4) for each exponential function.
Good to know
Questions teachers ask about this resource
Why does the worksheet include two separate versions?
Version 1 and Version 2 present parallel sets of exponential functions testing the same characteristics, so the worksheet can be reused for a second class period or as a retake without repeating the same problems.

No reviews yet
Downloaded this resource? Tell other teachers how it went.
Curriculum
Standards, concepts & topics
Standards
 Standards
- HSF-IF.B.4 — For a function that models a relationship between two quantities, interpret key features of graphs and tables in terms of the quantities, and sketch graphs showing key features given a verbal description of the relationship. Key features include: intercepts; intervals where the function is increasing, decreasing, positive, or negative; relative maximums and minimums; symmetries; end behavior; and periodicity. ★
Core concepts
 Core concepts
Domain and range
X- and y-intercepts
Horizontal asymptote
End behavior
Exponential functions
 Topics
More to explore
You may also like


