Graphing Functions - Finding Characteristics - Worksheet
- Grades
- Grades 10–12, High School
- File type
- Preparation
- Print ready


- Subject
- Math, Algebra
- Topic
- graphing, functions
- Resource types
- Worksheets & Printables, Worksheets
- Preparation
- Print ready
- Standards
- HSF-IF.C.7 HSF-IF.B.4 +1
About this resource
What's inside this resource
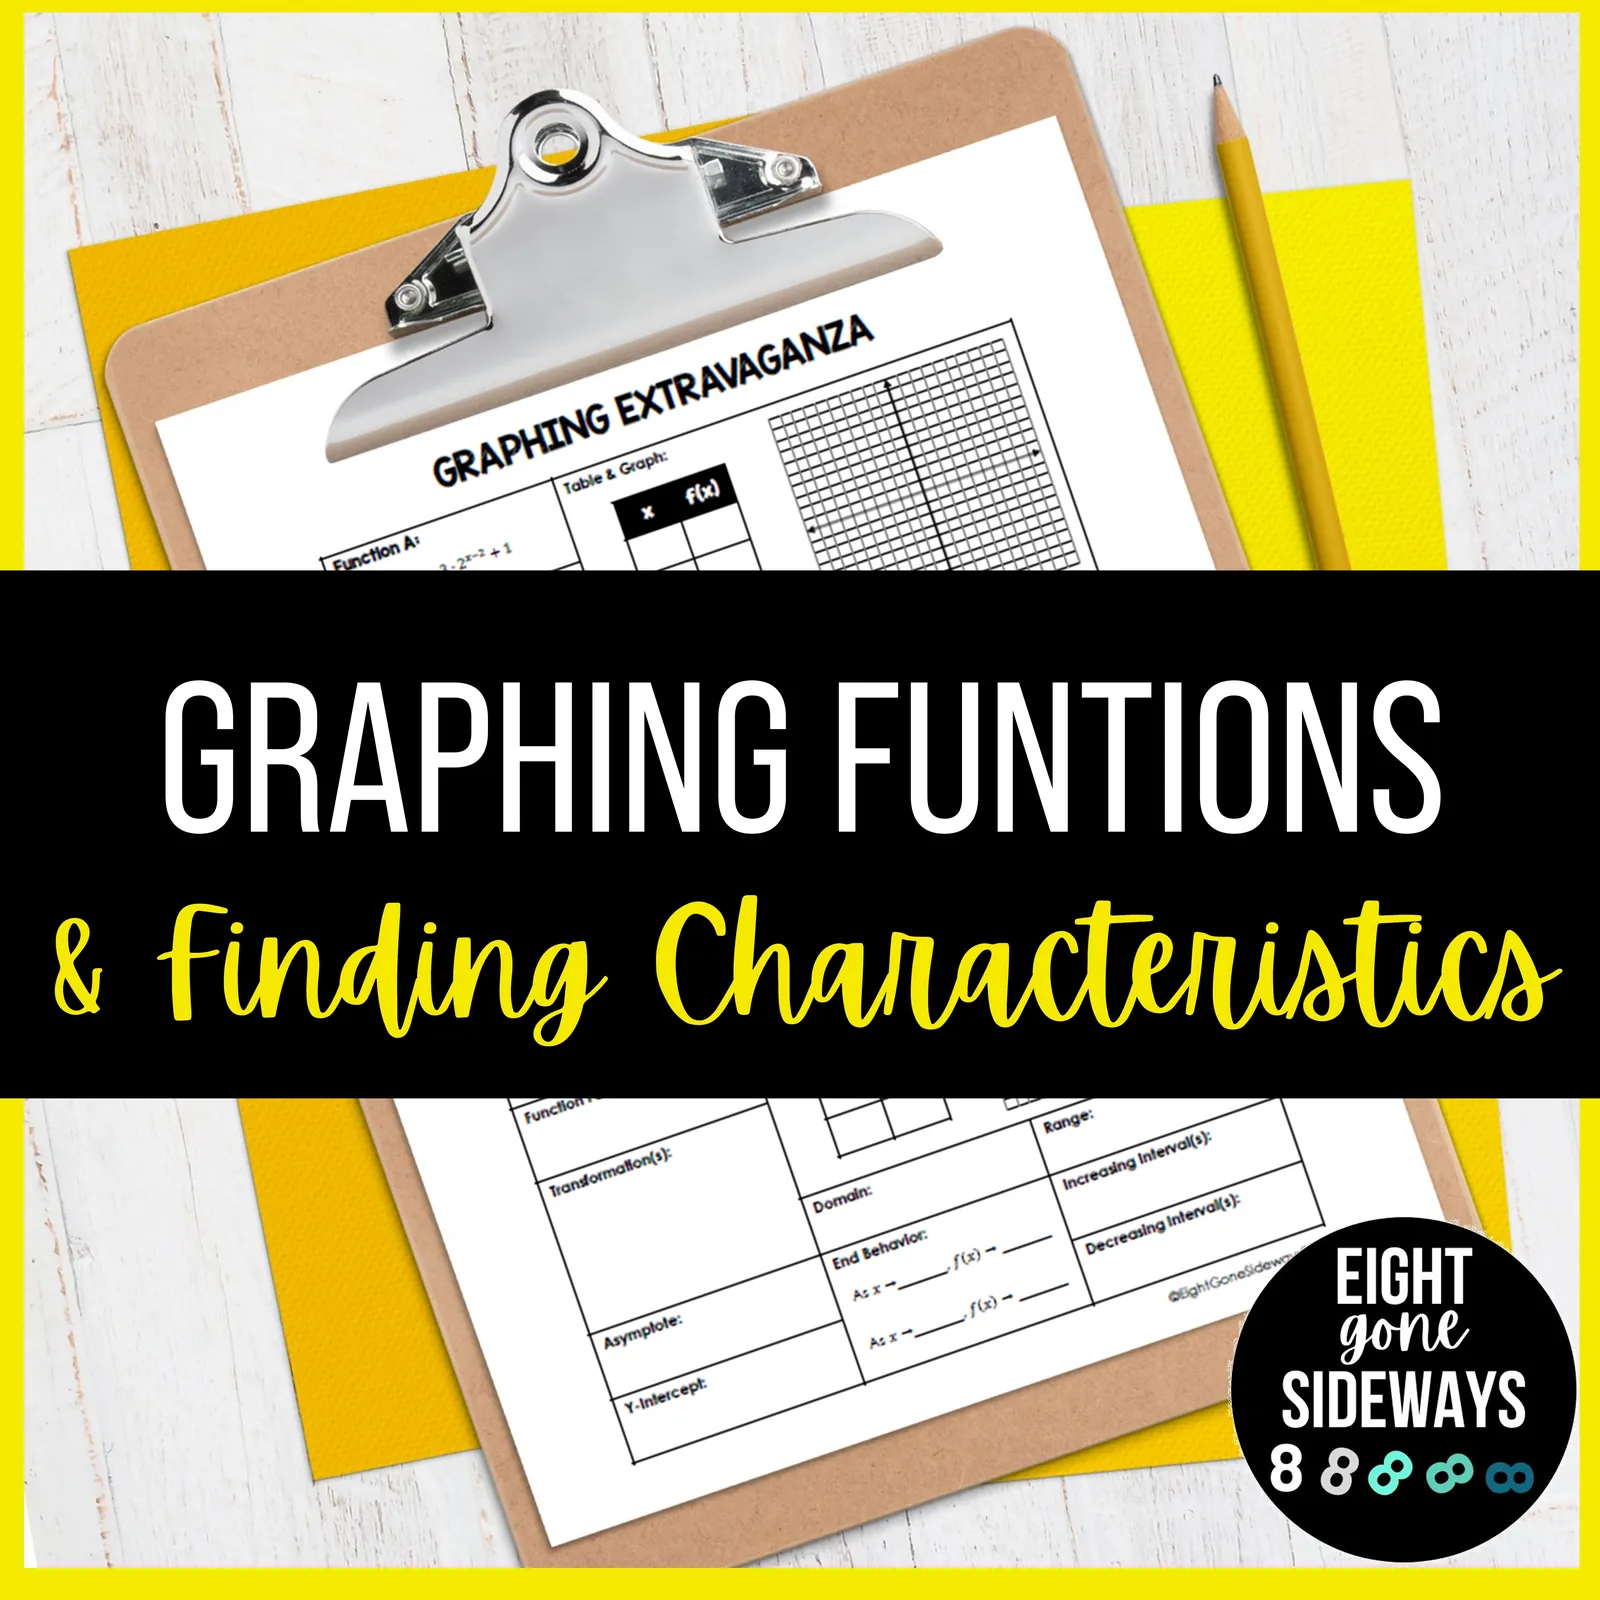
This is a Graphing printables/worksheets/worksheets-by-subject/math-worksheets/calculus-worksheets/functions-worksheet">Functions Worksheet that will give students practice with finding characteristics.
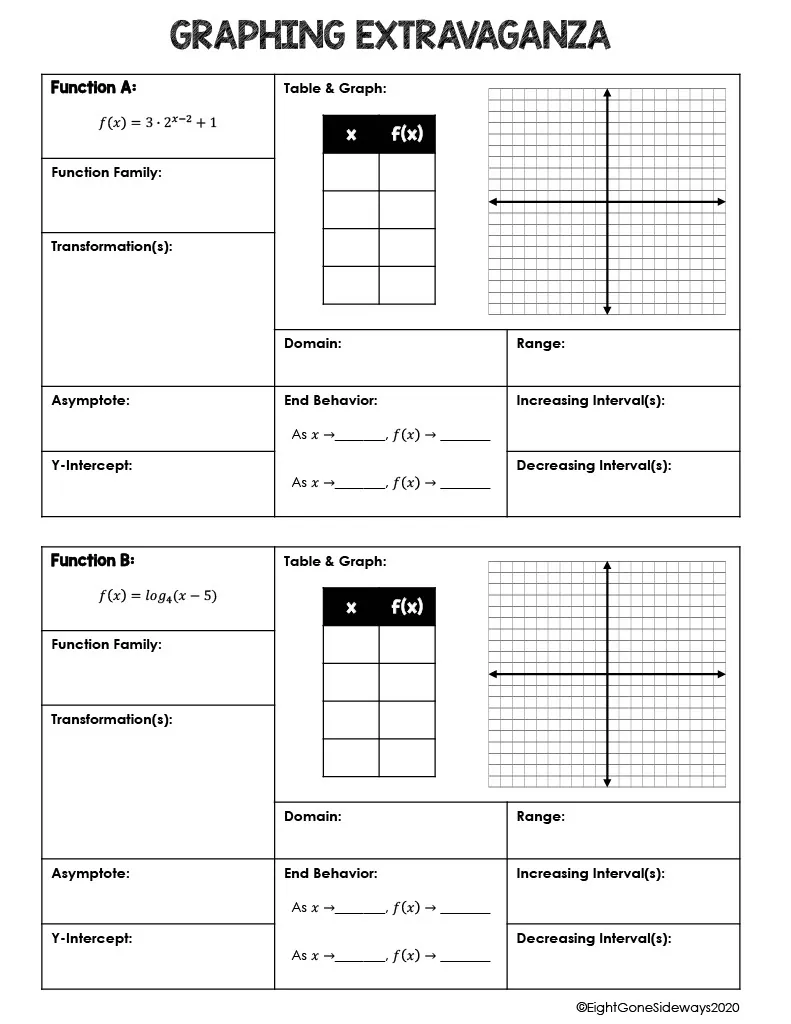
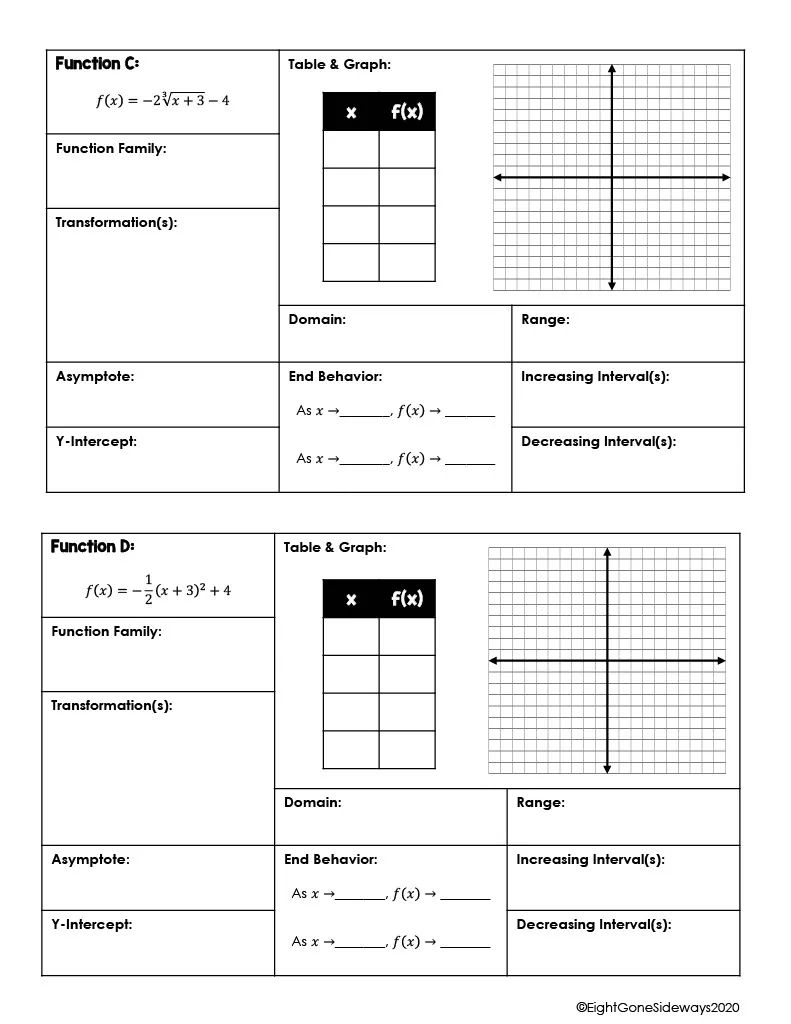
There are 16 problems -2 per page.
Students will find the Functions A-P, while exploring transformation, end behavior, range and so much more.
Related resources
More resources teachers may find useful
24 related resources were found using this product's title, contributor, categories and tags.


In the classroom
Teaching tips & learning objectives

Learning objectives
Classify a symbolic function into its parent family
Describe transformations (shifts, stretches, reflections) from the parent function
Sketch graphs from tables of values for sixteen transformed functions

Teaching tips
Assign one page (two functions) per day as Algebra 2 bell work — the identical grid keeps the routine constant while the family changes
Have students predict the transformation list before building the table, then check the sketch against it
Use the key's 'answers could vary' tables to discuss why chosen x-values differ while the graph's features do not

Skills covered
Function-family identification — students classify each of sixteen symbolic rules (exponential, logarithmic, rational, radical, absolute value, quadratic).
Transformation analysis — the key lists moves like 'shift right 2 units, vertical stretch by a factor of 3, shift up 1 unit' for each function.
Graphing from tables — every function includes an x/f(x) table feeding a hand sketch.
Good to know
Questions teachers ask about this resource
What does students' work on each function involve?
A full characterization, not just a sketch: they name the family, list every transformation from the parent function, complete a table and graph, then fill a grid with domain, range, asymptote, y-intercept, end behavior in arrow notation, and increasing/decreasing intervals.
Which function families appear across the sixteen problems?
A deliberate spread: exponential (3·2^(x-2)+1), logarithmic (log₄(x−5)), rational (1/(x+4) − 2), square-root and cube-root forms, absolute value (−¾|x+2|), and quadratics like (x+6)² − 5 — so every major parent graph from an Algebra 2 course gets exercised.

No reviews yet
Downloaded this resource? Tell other teachers how it went.
Curriculum
Standards, concepts & topics
Standards
 Standards
- HSF-IF.C.7 — Graph functions expressed symbolically and show key features of the graph, by hand in simple cases and using technology for more complicated cases. a. Graph linear and quadratic functions and show intercepts, maxima, and minima. b. Graph square root, cube root, and piecewise-defined functions, including step functions and absolute value functions. c. Graph polynomial functions, identifying zeros when suitable factorizations are available, and showing end behavior. d. Graph rational functions, identifying zeros and asymptotes when suitable factorizations are available, and showing end behavior. e. Graph exponential and logarithmic functions, showing intercepts and end behavior, and trigonometric functions, showing period, midline, and amplitude.
- HSF-IF.B.4 — For a function that models a relationship between two quantities, interpret key features of graphs and tables in terms of the quantities, and sketch graphs showing key features given a verbal description of the relationship. Key features include: intercepts; intervals where the function is increasing, decreasing, positive, or negative; relative maximums and minimums; symmetries; end behavior; and periodicity. ★
- HSF-BF.B.3 — Identify the effect on the graph of replacing f(x) by f(x) + k, k f(x), f(kx), and f(x + k) for specific values of k (both positive and negative); find the value of k given the graphs. Experiment with cases and illustrate an explanation of the effects on the graph using technology. Include recognizing even and odd functions from their graphs and algebraic expressions for them.
Core concepts
 Core concepts
Function families
Transformations
Domain and range
Asymptotes
End behavior
Graphing
Topics
 Topics
Explore more
Categories this resource belongs to
Explore related searches
More to explore
You may also like