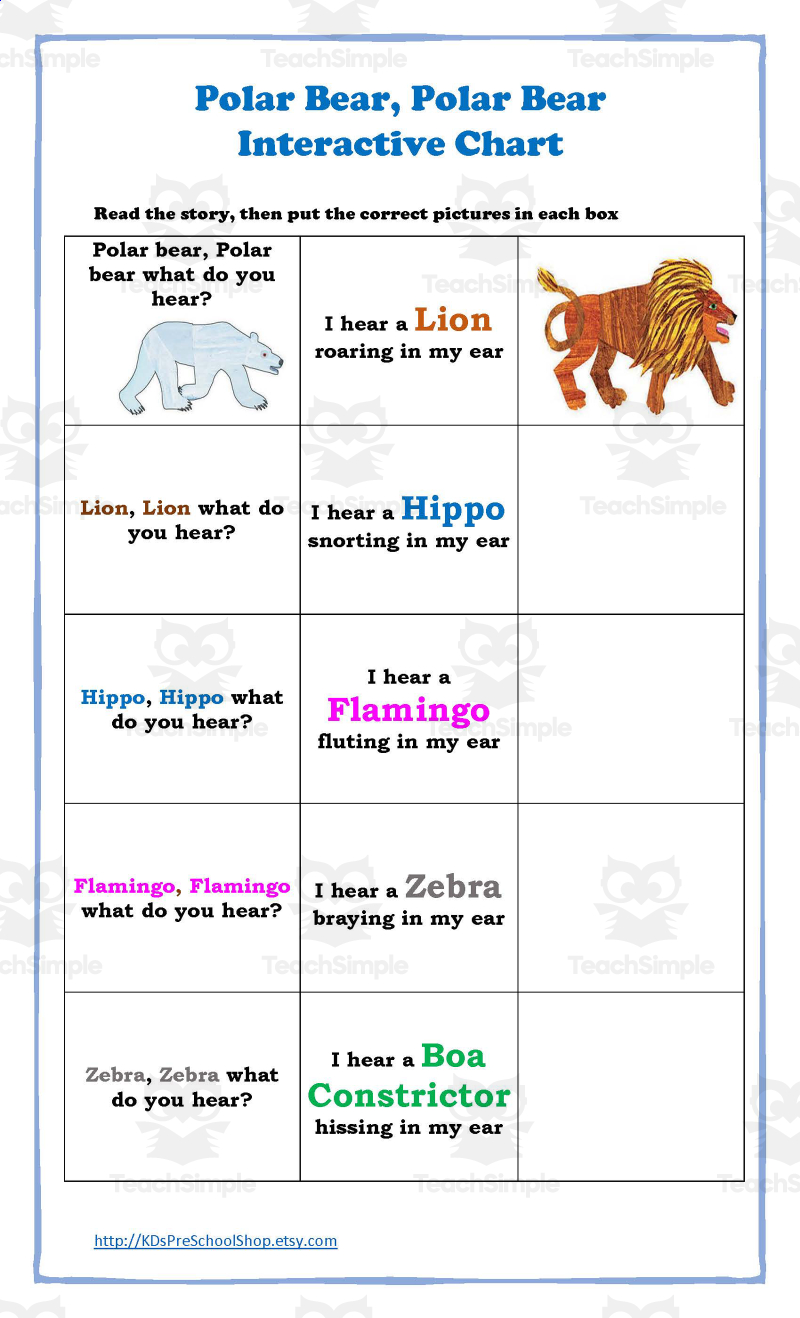
Polar Bear Interactive Chart | Book Companion
Polar Bear Interactive Chart | Book Companion This interactive sequencing chart makes an engaging companion resource for classrooms reading the children's book Polar Bear, Polar Bear, What Do You See?




674 resources
Explore sub-categories
1 sub-categories · 674 resources
Polar Bear Interactive Chart | Book Companion This interactive sequencing chart makes an engaging companion resource for classrooms reading the children's book Polar Bear, Polar Bear, What Do You See?
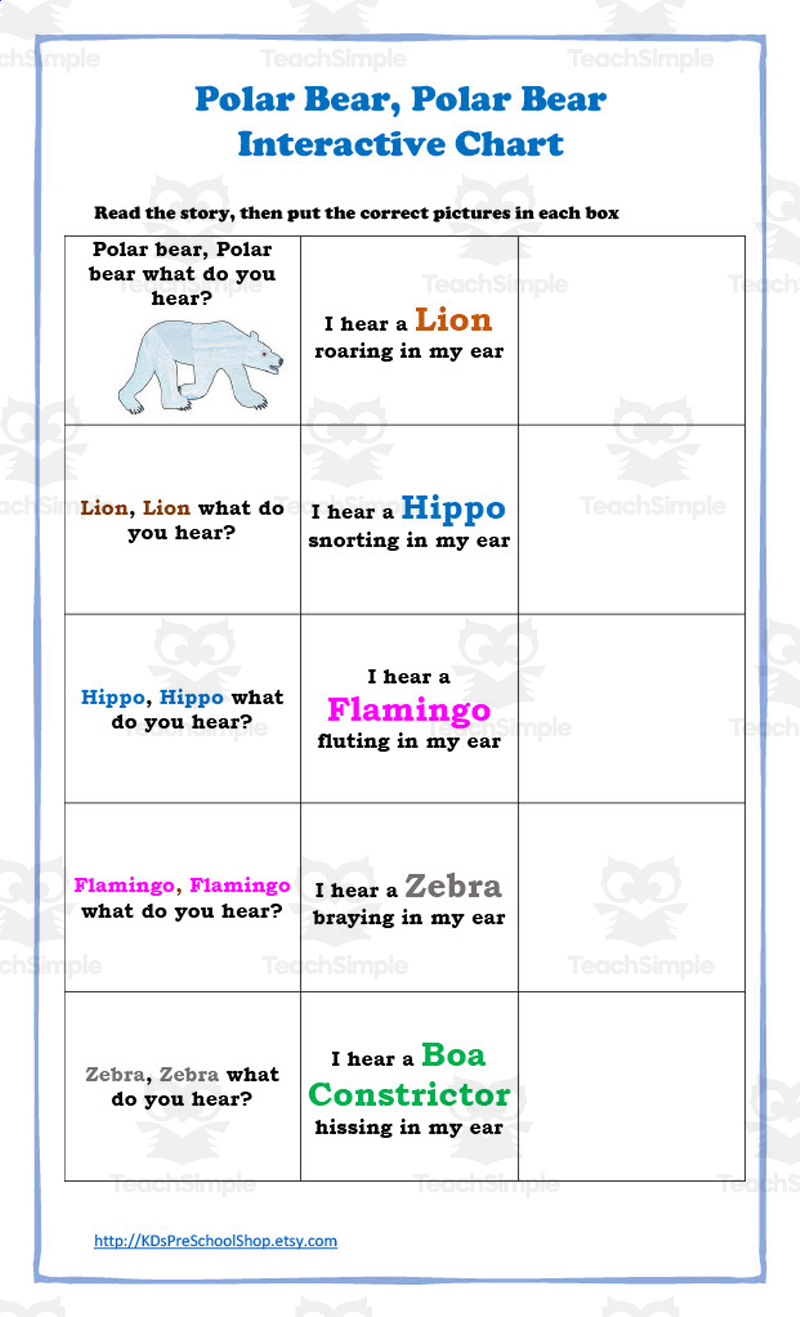
Support early literacy through a repetitive-pattern "Polar Bear, Polar Bear, What Do You Hear?" style story chart pairing animals with the sounds they make.

This worksheet can help your students compare two stories with similar plots or characters. It can be a useful tool to help them understand the elements from the two stories.

Build a thermometer-shaped book log from the supplied cut-out sections. Four pages in color and four in black and white provide numbered lines through 100, a named base and a goal banner. Choose a target of 10, 25, 50, 75 or 100 books, trim at the selected number and assemble the display. Students record completed titles on the lines to see progress toward the agreed goal.
 Free download
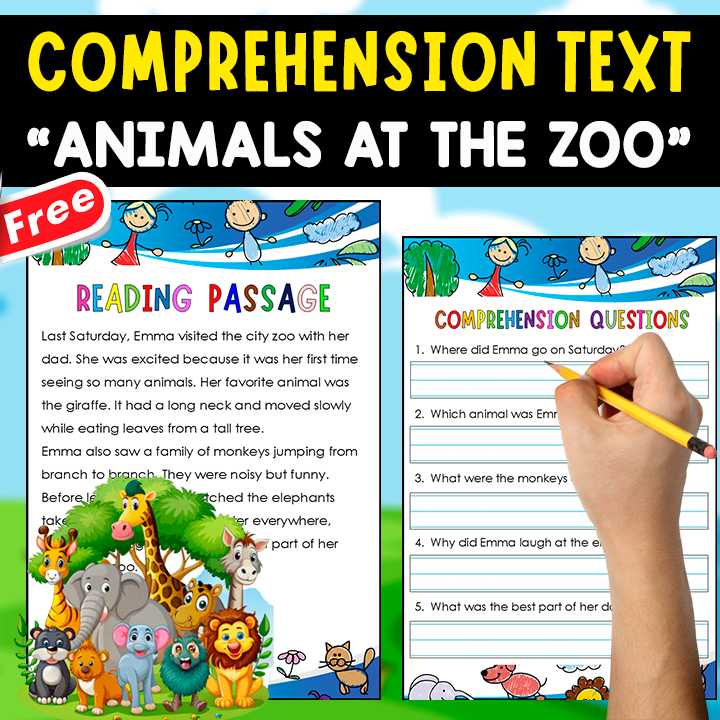
 A short ESL/early-reader comprehension pack using a simple fiction passage about a family visit to the zoo, paired with four reading-strategy anchor-chart activities (predict, visualize, question, summarize) and a vocabulary box.
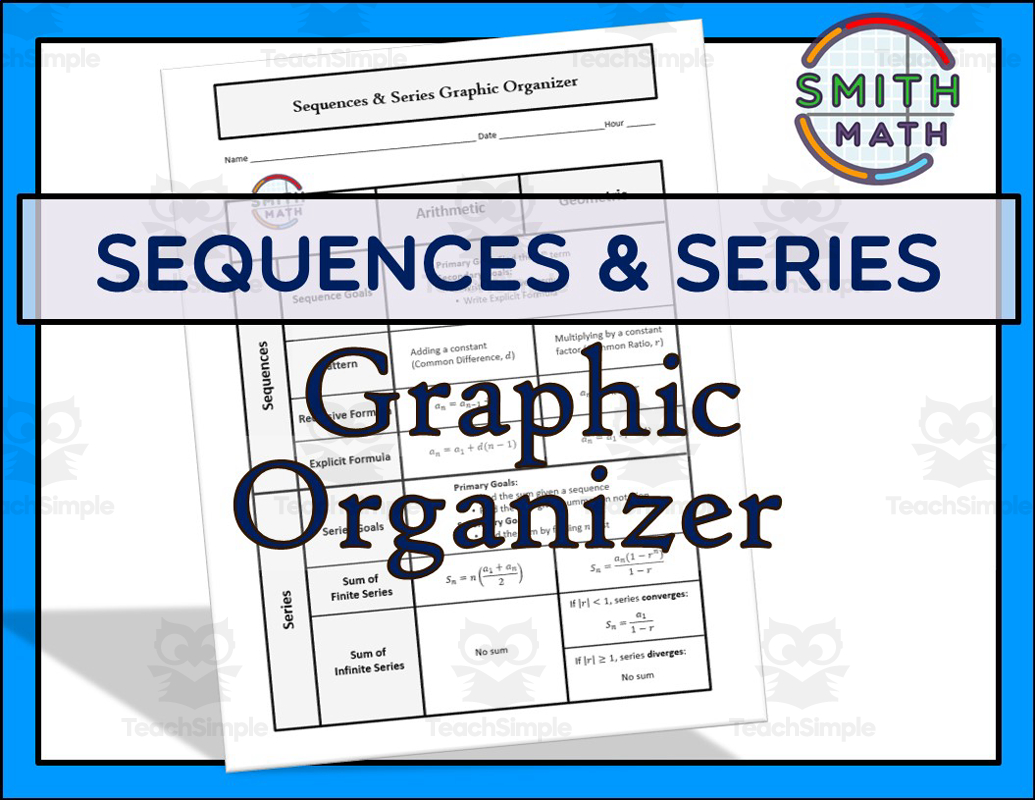
If you are a high school math teacher, finding resources that best serve for your students is of the utmost importance! This is a Sequences and Series Graphic Organizer that is filled with purposeful information that your students can put…

A five-step Somebody/Wanted/But/So/Then framework walks students through identifying a story's main character, goal, problem, attempted solution, and ending, and it appears twice — once fully worded as a teacher or display copy, and once with key words blanked out for students to fill in themselves. A second, matching chart titled ‘Summarizing’ explains that a summary retells a story's main events and lists the five elements to include (characters, setting, problem, events, solution) using the same SWBST acronym, again in both a complete and a fill-in-the-blank version. Together the four pages form a two-part anchor chart set meant to be posted for reference and then reinforced through an interactive-notebook-style blank version students complete in their own notes. The charts can support story retelling alongside a teacher-selected text.

A reference chart/worksheet of Spanish irregular preterite verb stems and endings for students to study and practice conjugating.

This resource is a Squirrel's New Year's Resolution Interactive Reading Packet. This is a great component to your early finisher buckets or reading stations during the winter season.

Anchor charts and assessments teaching kindergarten students (RL.K.3) to identify characters, setting, and major events in a story.
 Free download
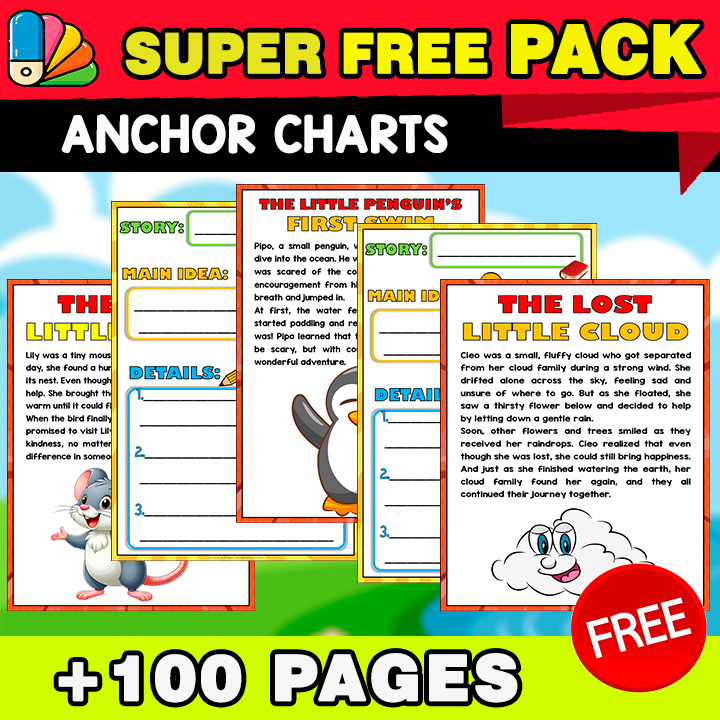
 A bundle of short original English stories/fables (including at least one classic fable, 'The Lion and the Mouse') each paired with a main-idea-and-details reading-comprehension anchor chart, provided in both a completed worked example and a blank student-practice template.
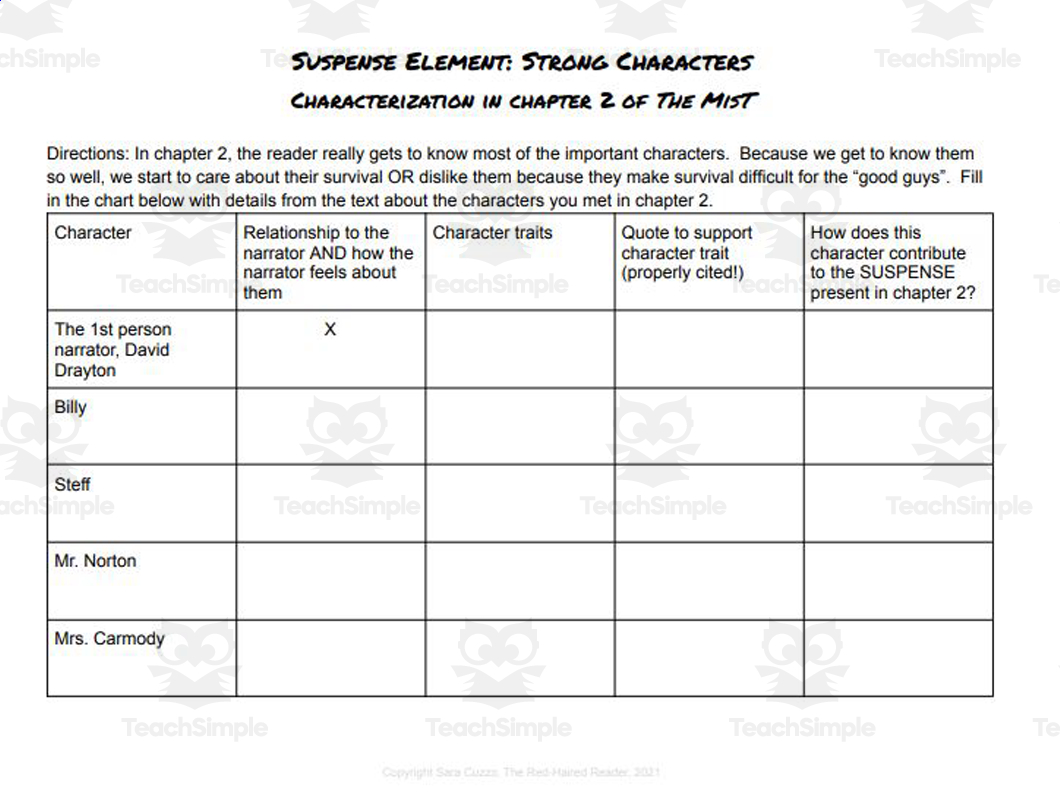
Analyze Suspense in Stephen King's The Mist Chapter 2\nThis 4-page Google Doc resource helps students study suspense in chapter 2 of Stephen King's horror novella The Mist.
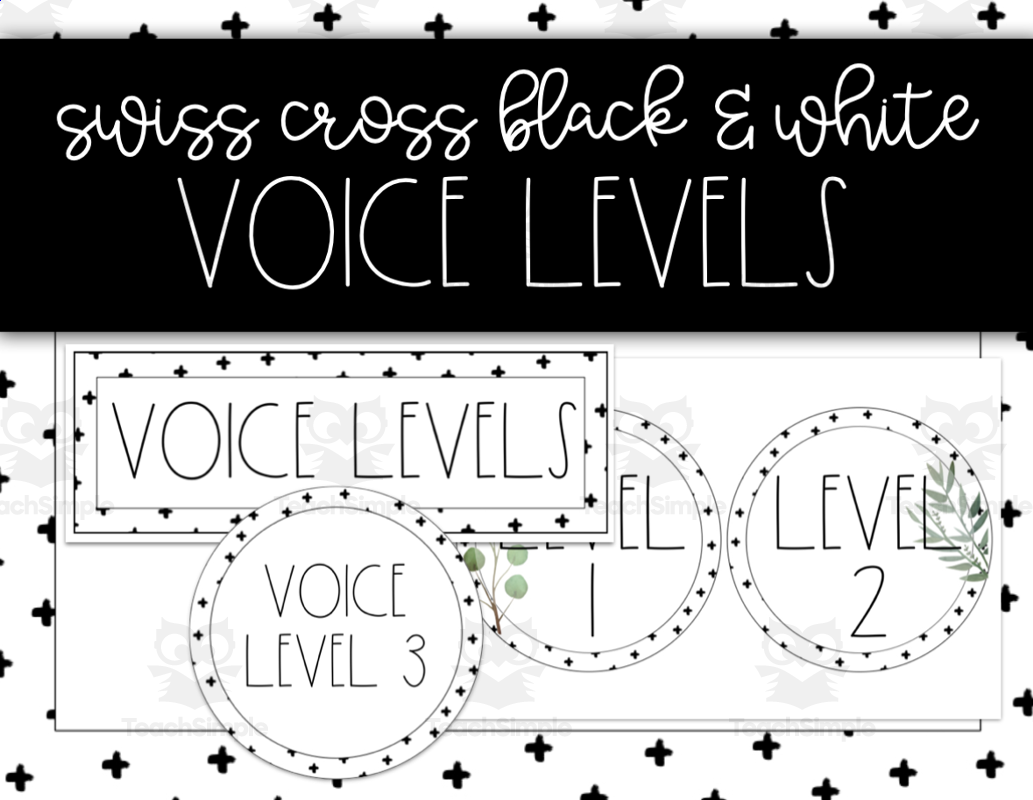
Use this to create your own voice levels chart for your classroom - either just as posters, a clip chart, or use tap lights to create a whole display.
 Free download
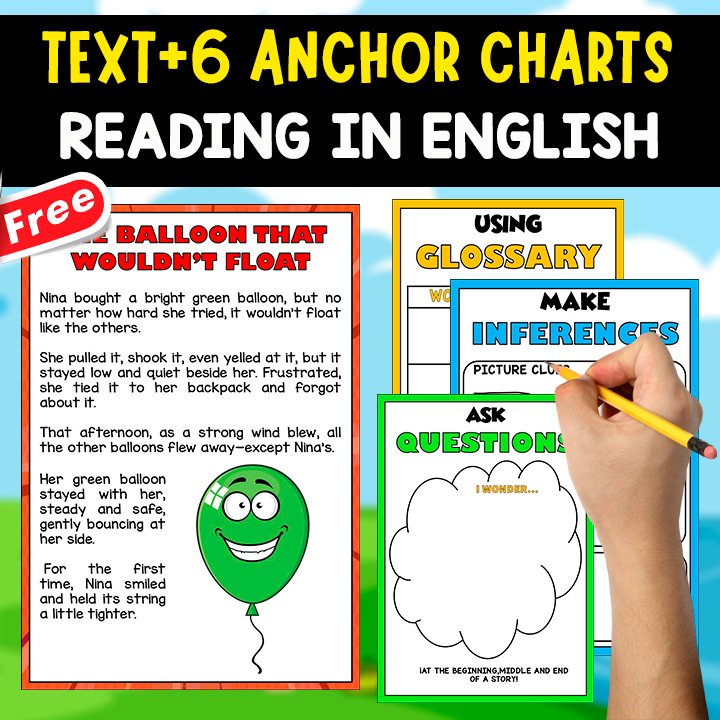
 Reading comprehension anchor chart set built around an original short story, teaching main idea, details, and comprehension strategies.
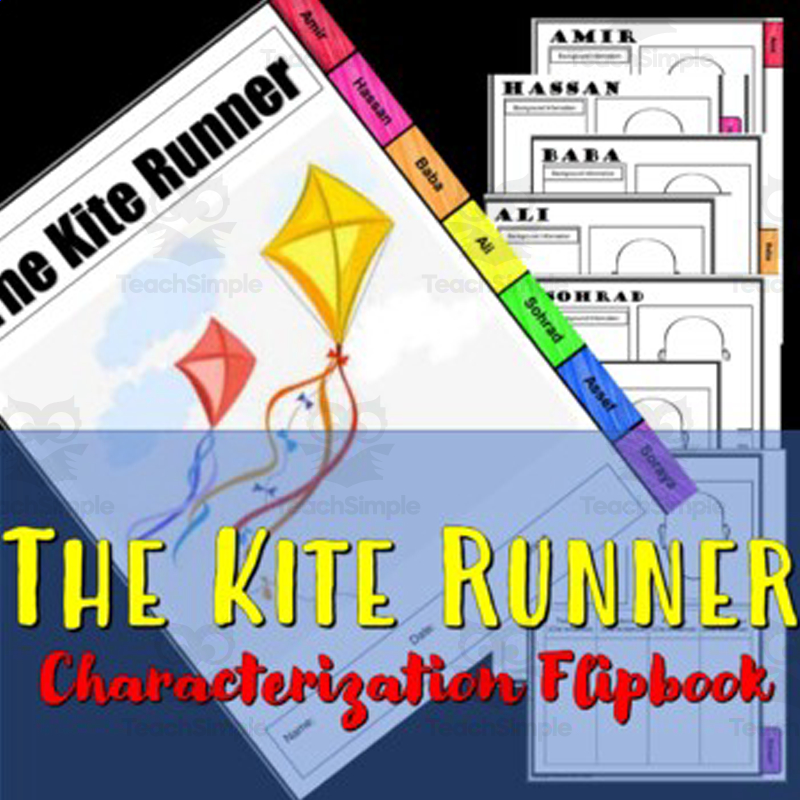
The Kite Runner Characterization Flip Book This unique teaching resource is perfect for students from Grades 7 through 12. It's designed as a book companion, taking the user on an enlightening journey through the main characters of the…

Title: Tooth Graph and Class Birthday Chart Welcome to the Tooth Graph and Class Birthday Chart! This unique, easy-to-use teaching resource is designed to create a visually appealing and interactive learning environment.
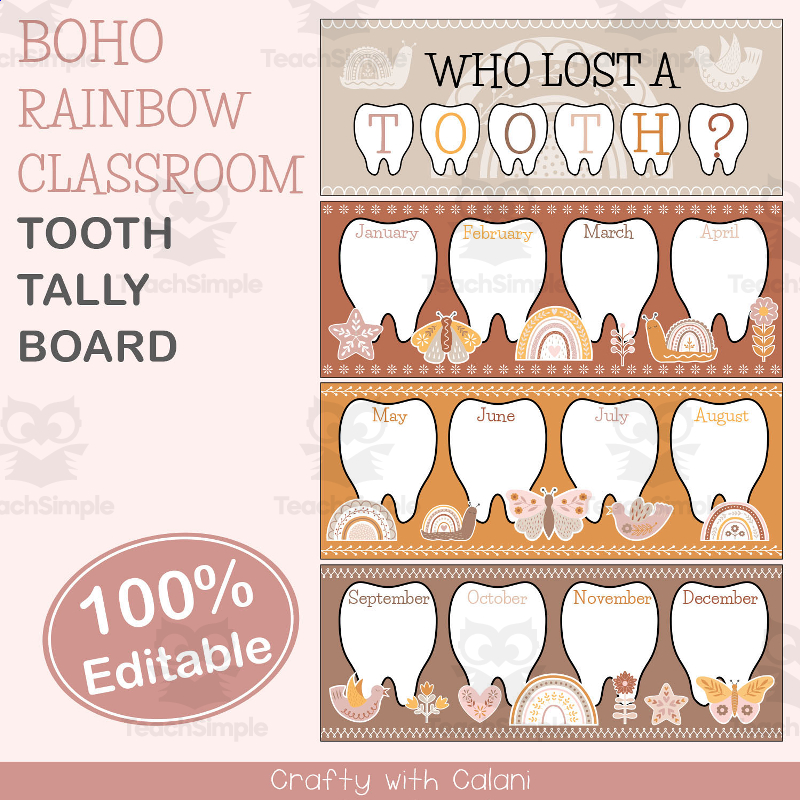
Editable classroom tooth-loss tally chart/poster (Boho Rainbow theme) for tracking and graphing which month students lose teeth, used as a classroom-management and math data activity.

This activity is perfect for teachers who want to help their students improve reading comprehension skills and track their progress. This activity is perfect for teachers who want to help their students improve reading comprehension…
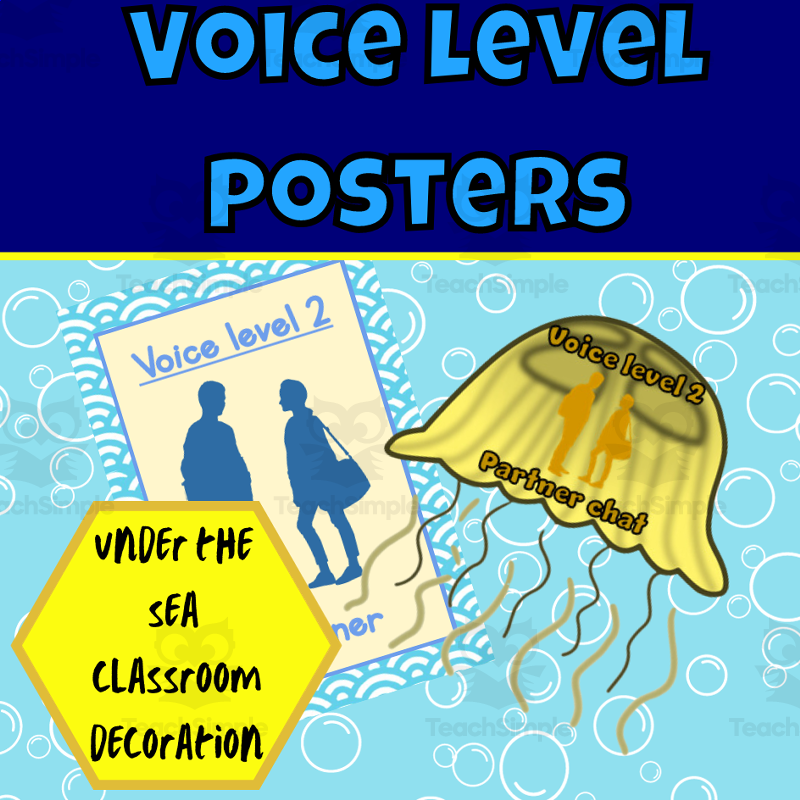
A printable classroom-management poster set of under-the-sea themed voice-level indicators (0 through 4), helping students understand and self-regulate appropriate volume for different classroom/school settings.
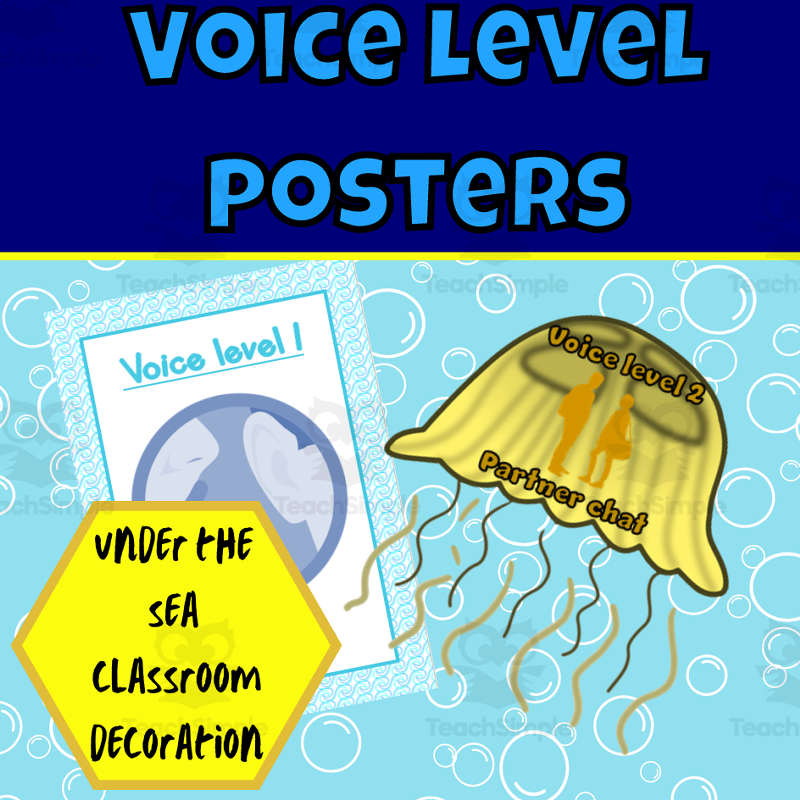
The best part about decorating your classroom is picking and choosing your favourite designs that best appeal to your students, the idea behind this classroom decoration is to give you as a teacher the opportunity to pick your favourite…
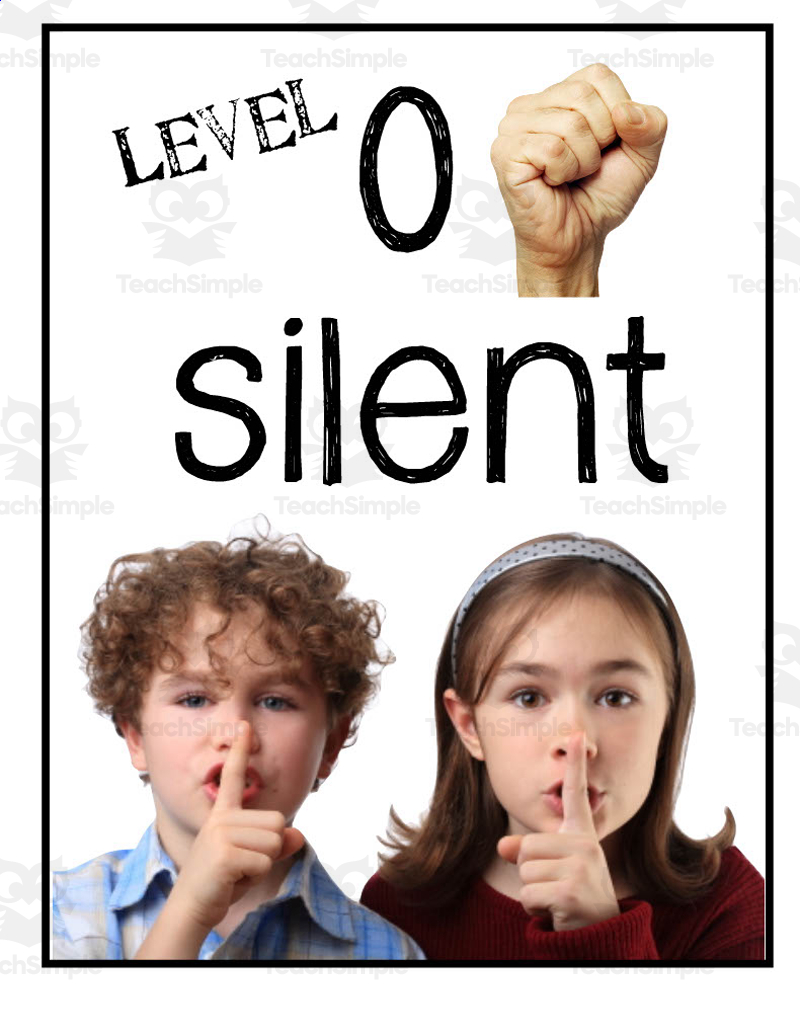
Set of classroom posters showing a 0-5 voice-level scale for classroom-management visual reference.
 Free download
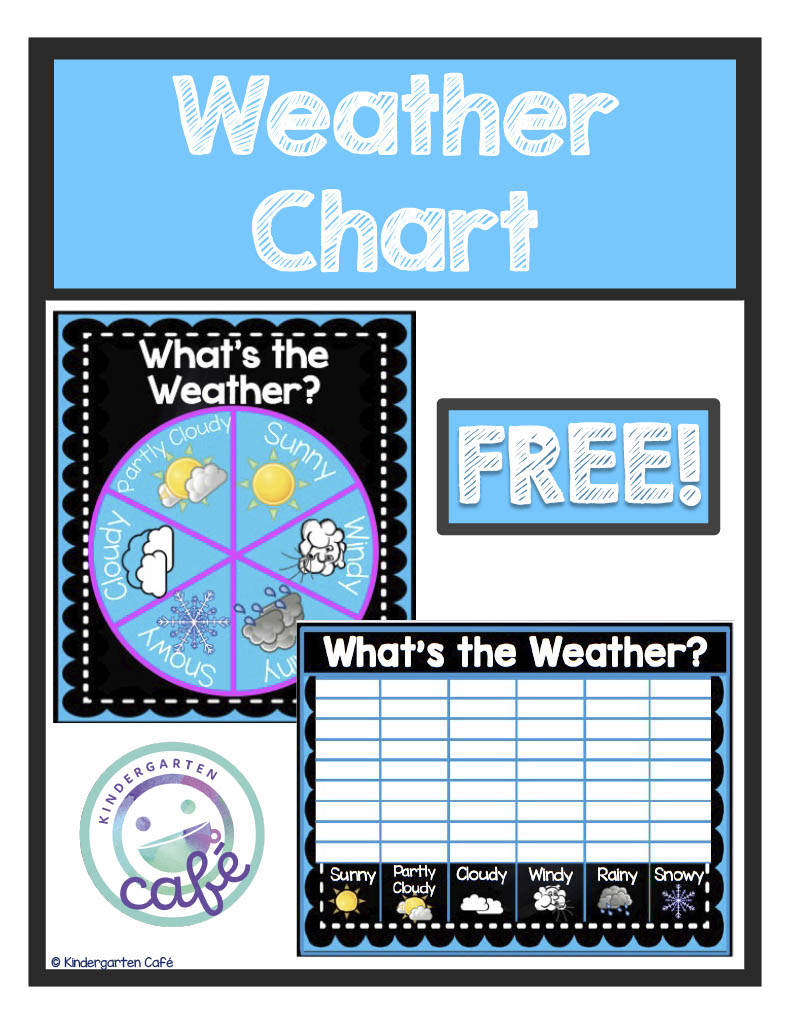
 What's the Weather? Spinner and Chart is a teaching resource that focuses on weather concepts for elementary school students. This printable PDF includes two components - a circle spinner chart and a blank graphing chart with a chalkboard…

What's the Weather? Spinner and Chart in Neon Design This interactive and visually striking tool is available in a PDF format, consisting of three pages ready for printing. It's perfect for children ranging from Preschool to Grade 2.
 Free download
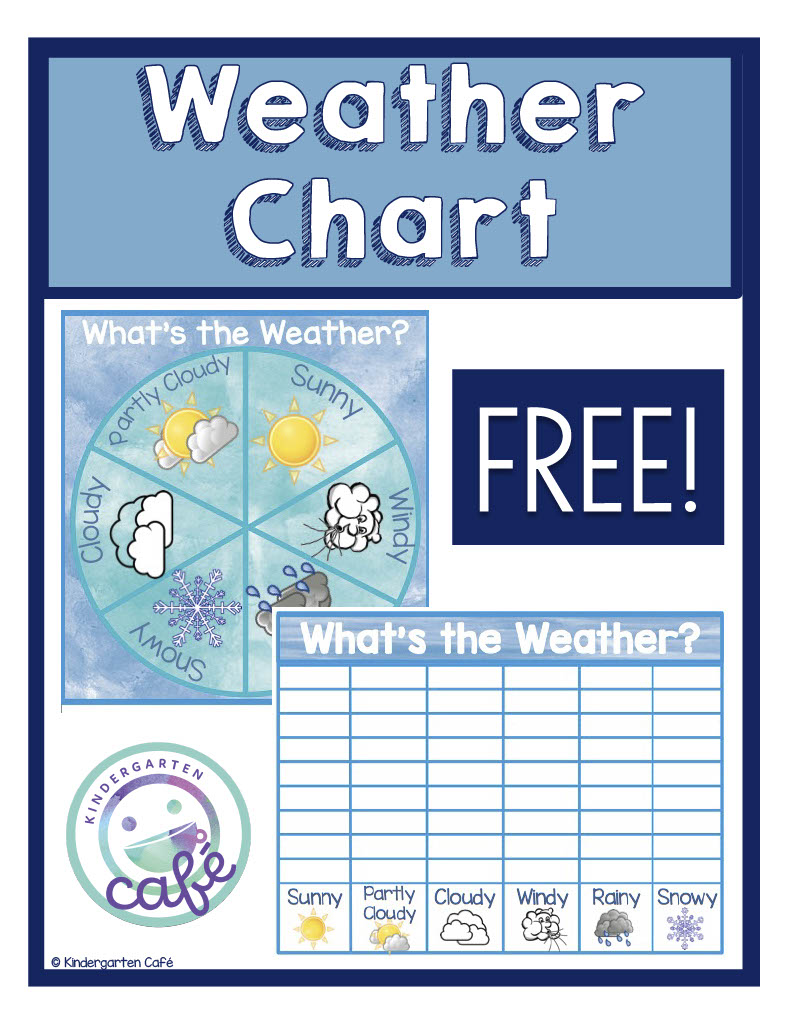
 What's the Weather? Spinner and Chart This useful weather chart set can enhance elementary science lessons on meteorology. The set contains a spin wheel and graphing chart displaying common weather types like sunny, cloudy, rainy, snowy…