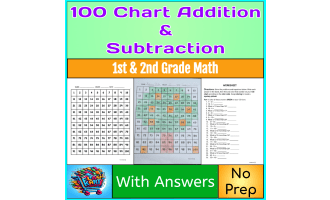
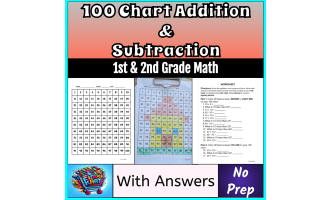
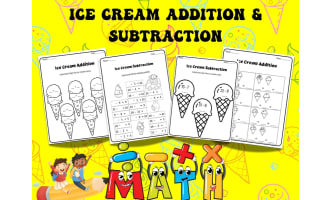
100 Chart Addition & Subtraction Mystery Picture Reveal | Ice Cream


About This Product
100 Chart Addition & Subtraction Mystery Picture Reveal | Ice Cream
Adding and subtracting within 100 can be challenging for young learners. I created this 100 chart mystery picture activity to give students a fun and visual way to practice these skills while building number sense and confidence.
What's Inside?
In this resource, students solve addition and subtraction problems and use their answers to complete a 100 chart color by code activity. They will practice finding 10 more, 10 less, adding small numbers, subtracting small numbers, and solving addition and subtraction problems within 100.
Students write each answer, find that number on the 100 chart, and color it according to the color code. As they work through the problems, a cute ice cream cone mystery picture is gradually revealed!
This resource includes practice with:
Adding 10
Subtracting 10
Finding 10 more
Finding 10 less
Adding small numbers such as 2, 3, and 7
Subtracting small numbers
Addition and subtraction within 100
Number patterns and number relationships
Using a 100 chart to solve problems
Grades
This activity is best suited for:
1st Grade
2nd Grade
It can also be used with advanced level kindergarten students who are ready to work with addition and subtraction within 100.
Resource Features
No-prep Math activity
100 chart practice
Addition and subtraction within 100
10 more and 10 less practice
Color by code mystery picture
Number sense practice
Independent practice
Answer key included
Fun ice cream-themed picture reveal
Ways to Use It
I created this activity to be flexible enough for different learning settings. You can use it for:
Math centers
Independent practice
Morning work
Early finishers
Small-group instruction
Math intervention
Homework
Homeschool lessons
Math review
Students can work through the problems independently, with a partner, or with teacher support.
How It Supports Learning
I wanted this activity to make addition and subtraction practice a little more engaging for young learners. Instead of simply solving a list of problems, students use a 100 chart to see how numbers change when they add or subtract.
The mystery picture also gives students something fun to work toward while encouraging them to solve each problem carefully.
Common Core Connections
This resource supports the following Common Core math skills:
CCSS 1.NBT.C.5: Mentally find 10 more or 10 less than a given two-digit number.
CCSS 2.NBT.B.5: Fluently add and subtract within 100 using strategies based on place value and properties of operations.
CCSS 2.NBT.B.8: Mentally add or subtract 10 or 100 from a given number.
100 chart, hundred chart, addition within 100, subtraction within 100, 10 more, 10 less, addition activity, subtraction activity, color by code, mystery picture, number sense, first grade math, second grade math, math centers, math review
Resource Tags
0 Reviews
Check out these other great products