Algebra 2 End of Year Project | Exponential Growth: Coronavirus
- Grades
- Grades 9–12
- Pages
- 23
- File type
- Multiple File Types
- Editable
- Yes


- Subject
- Math, Algebra
- Topic
- Algebra 2, End of year project
- Resource types
- Projects
- Editable
- Yes
- Standards
- HSF-LE.A.1
Product description
From the author
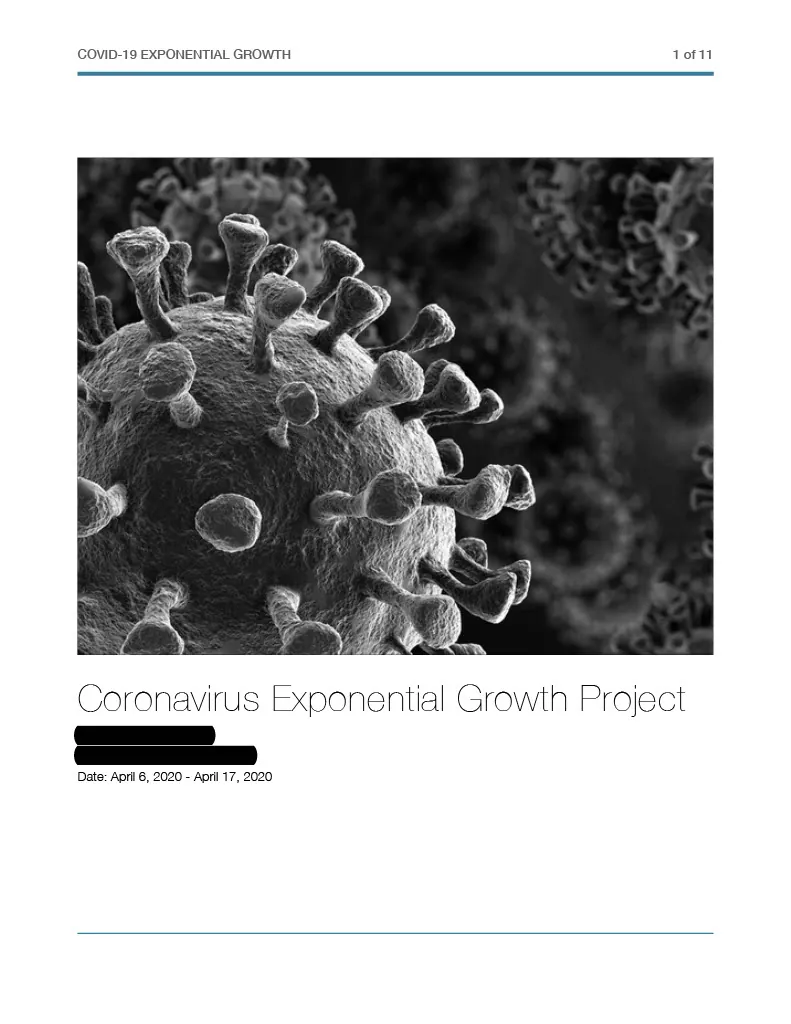
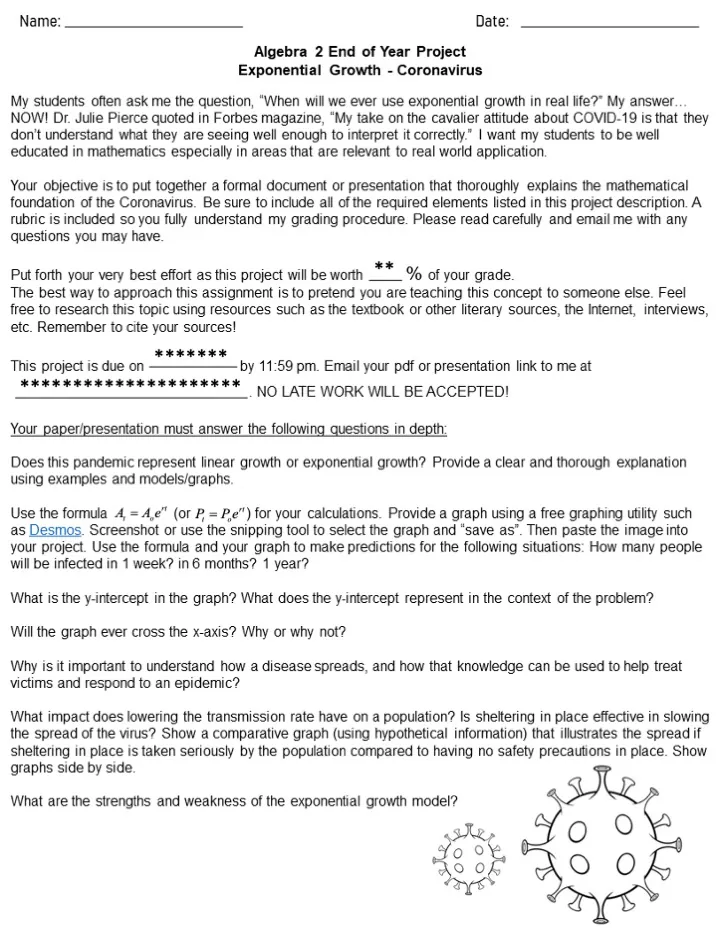
This resource is a Coronavirus Exponential Growth Project.
This project was designed with your Algebra 2 students in mind - deemed appropriate for an end of the year math project.
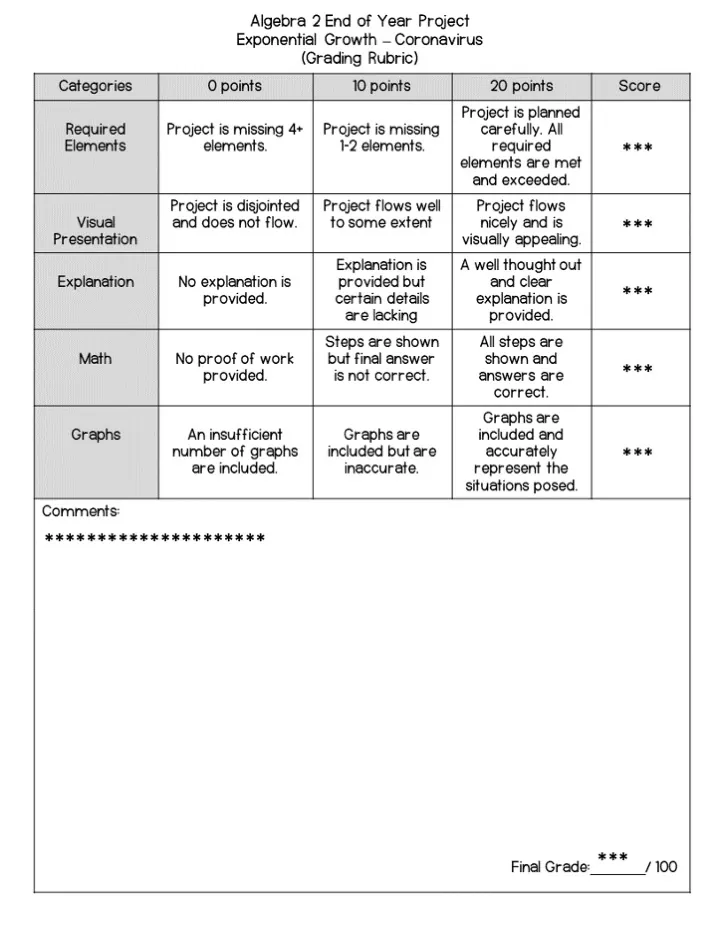
Instructions for completing this project are included. There is a grading rubric and a student sample for students to see.
Related resources
More resources teachers may find useful
24 related resources were found using this product's title, contributor, categories and tags.


In the classroom
Teaching tips & learning objectives

Learning objectives
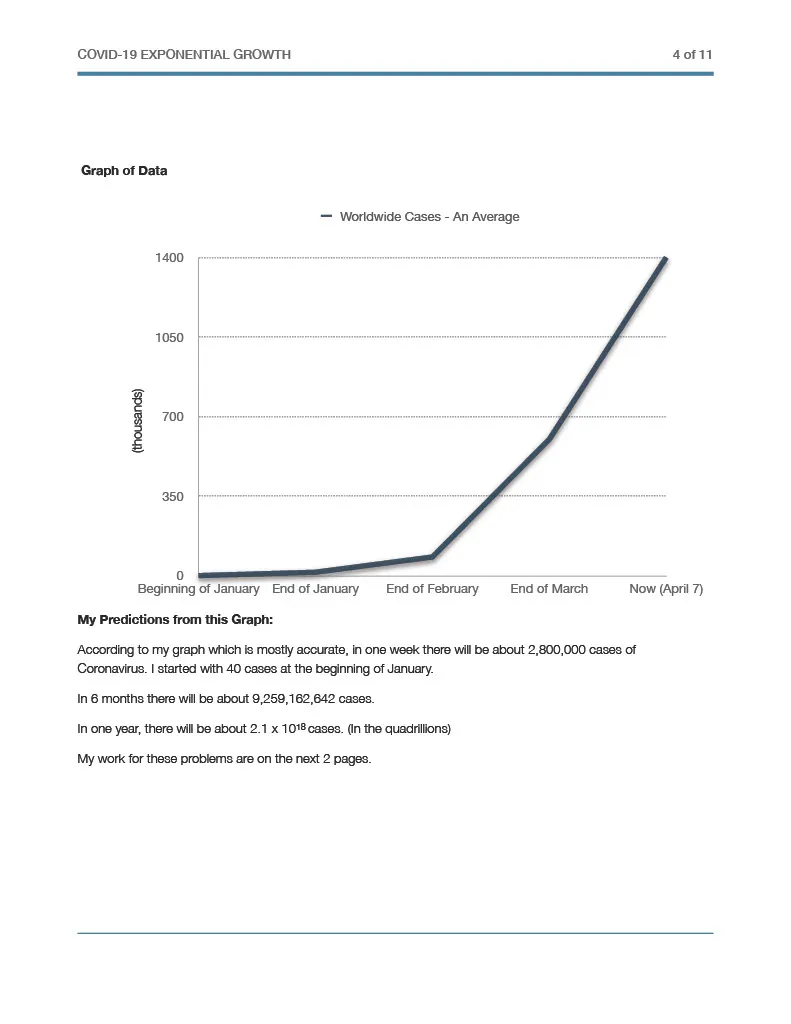
Distinguish exponential growth from linear growth using a real-world data graph.
Interpret the y-intercept and consider whether the growth graph crosses the x-axis in the context of the modeled quantity.
Evaluate the strengths and limitations of an exponential growth model, including its assumption of a constant growth rate.

Teaching tips
- Use the rubric to discuss the expected graph and explanation before students start.
- Have students state the time period and assumptions used in their model.

Skills covered
Exponential vs. linear growth comparison — students graph and contrast the two growth types using real case data.
Graph interpretation — students interpret the y-intercept and discuss whether the graph crosses the x-axis in context.
Model evaluation — students weigh the pros and cons of using an exponential model to predict real-world change.
Good to know
Questions teachers ask about this resource
What support is included for planning a presentation?
The resource supplies project instructions, a grading rubric, and student examples in writing and slideshow formats. These show an organization for presenting the graph and explanation.

No reviews yet
Downloaded this resource? Tell other teachers how it went.
Curriculum
Standards, concepts & topics
Standards
 Standards
- HSF-LE.A.1
Core concepts
 Core concepts
Exponential growth
Linear vs. exponential functions
Graph interpretation
Mathematical modeling
 Topics
Explore more
Categories this resource belongs to
Explore related searches
More to explore
You may also like