Grade 6 Statistical Questions and Data Displays Worksheets



About This Product
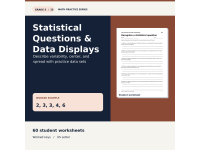
Start with a question that will have various responses. Students then use visuals and summary statistics to describe their observations of the data set, including ties and variance in dispersion.
Skills covered
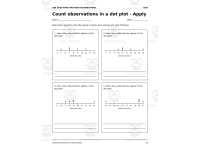
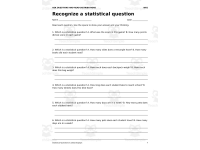
- Understand statistical questions and interpret dot plot frequencies.
- Calculate precise means, medians, ranges, and interquartile ranges.
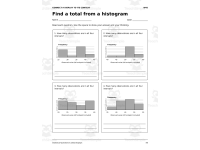
- Analyze intervals of histograms and link quartiles and dispersion to box plots.
First, identify whether you are dealing with values or frequencies and look for any ties. If finding quartiles, clarify which of the median-of-halves procedures is used in the page.
Includes in the download
- One 96-page US Letter PDF.
- 60 student work sheets, including one opening check, two checkpoints, and one closing check.
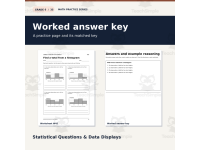
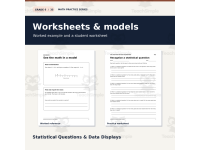
- 30 pages of answers and examples, along with opening guide, worked examples, and reflection.
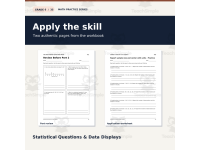
The separate storefront preview contains eight pages, including a work sheet and its answer key.
Choose the right size to fit your printer paper. Choose pages based on skills needed for a math station, independent practice, or quick review after instruction.
Resource Tags
0 Reviews
Check out these other great products